Though crude prices are rising, US shale producers face questions over whether their improving oil production results and cost efficiencies will last as increasing drilling activity drives demand for oilfield services. Countering a raft of negative outlooks, a new study argues that the unconventional sector has reason to be optimistic about the months and years ahead.
Thanks to a greater understanding of geology and improved technology application, the new generation of horizontal wells completed during the downturn are outperforming their predecessors by wide and growing margins, according to the study published by the Oxford Institute for Energy Studies in November, “Unravelling the US Shale Productivity Gains.”
The bottom line, as this study sees it, is that the well productivity and efficiency benchmarks established over the past 2 years represent sustainable progress that cannot be wholly attributed to high-grading programs or service sector price concessions. The expectation is that many operators will be able to offset the approaching financial headwinds with higher producing wells.
These conclusions are based on the performance of operators in several key shale plays where not only are initial production rates improving—an early measure of success—but so are two other important performance indicators: higher cumulative production and slower decline rates.
“This is extremely promising for long-term US oil production and the overall health of these operators,” said Trisha Curtis, author of the study and president of the Denver-based market research firm PetroNerds. “It means that once they’ve sunk their costs in the beginning, they will be getting more cash flow out of the wells later on by flattening out decline curve tails and lifting them up a bit.”
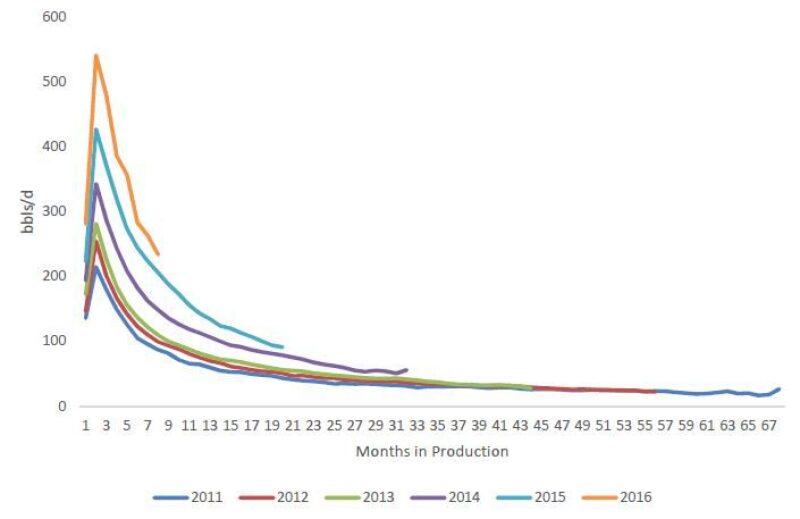
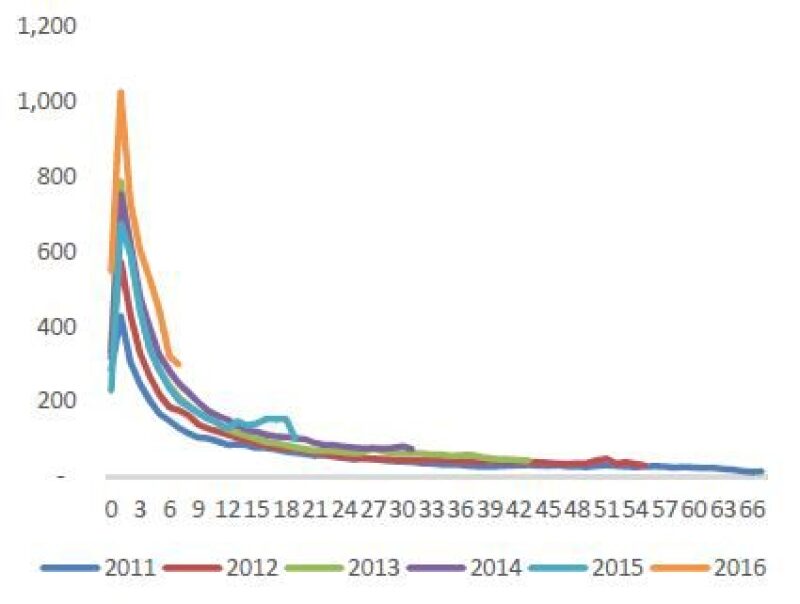
Using aggregated well data from three of the most active areas in the US, the Permian, Williston, and Powder River basins, the study shows that from 2014 to 2016 annual production totals soared 41%. The combined 60-month estimated ultimate recovery rates for that same span are up 22%.
The data also show that gains are strongest in the first 2 years of production, after which output begins to track closer to historical baselines. But from a reserves perspective, the trend lines Curtis identified through her research may signal that some unconventional producers are boosting ultimate recovery rates of oil-in-place, often pegged in the single digits for shale reservoirs. To put this in perspective, a 1% increase in recovery for the largest oil-rich shale plays would translate into millions of extra barrels produced each year.
Widespread Improvements
In terms of recent production growth, no other shale play comes close to the Permian. Through the downturn, oil production from horizontal wells in the Permian has risen by nearly half a million barrels to more than 1.2 million B/D.
Initial production rates there have increased sharply from 300 B/D in 2013 to about 550 B/D in 2016. A look at the decline curves shows that, on average, Permian wells completed in 2016 generated about the same daily output after 8 months as a 2013 well’s peak daily production rate, typically reached in its first 3 months.
Operators working in the Williston of North Dakota, home to the Bakken and Three Forks formations, are achieving average initial production rates close to 500 B/D. That figure is up by almost 100 B/D in 2 years.
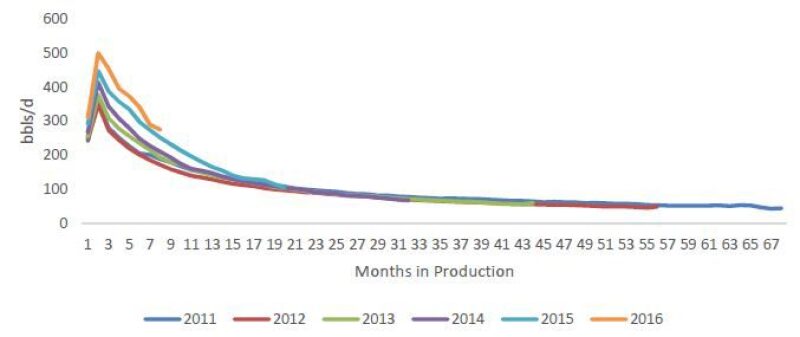
Unlike in the Permian, many operators in the Williston had acreage positions held by production when the downturn arrived, which contributed to the region’s steep rig count drop. Despite this, in 2015 and 2016, Williston operators managed to turn in the biggest production improvements in several years. Curtis predicted that production and overall well performance will be on the rise for at least the next couple of years as drilling picks up steam.
Not mentioned in the study, but worth noting, is that from September to October of this year, Bakken production surged by 70,000 B/D—the largest month-to-month increase that play has ever recorded.
Completion Design Changes
Curtis found that no single technological advance has been responsible for the recent progress. Desperation has played a bigger role, handing operators the motivation they need to make the best use of existing technologies such as microseismic, geomechanical modeling, and rock core analysis.
By doing more of this geophysical homework, shale operators have become adept at the optimal placement of lateral sections inside tight pay zones. They have also designed more effective hydraulic fracturing treatments that use double and triple dosages of sand and water.
However, skeptical industry analysts maintain that the affordability of these advances will evaporate when oilfield service and supply costs normalize.
There is also doubt surrounding the durability of higher production rates since many operators are considered to be high-grading their best acreage. This line of thinking holds that as the number of prime drilling locations dwindles, so will the production rates of future wells.
Curtis is not convinced by these points and believes instead that oil production from new wells is on track to offset increasing expenses. “Generally speaking, I don’t think that many in the analytical community have a full grasp on how these operators have changed the way they are drilling and completing these wells,” she said. “Service costs are certainly going to go up, and there will be some problems with that, but operators are in the very early innings of advancing well productivity and they have a lot of running room left.”
The biggest change operators have made, and one Curtis said most analysts have missed, is that instead of trying to punch through the rock with long and extensive fracture networks, shale producers are now focused on making shorter fractures to “rubble-ize” the area around the wellbore.
Curtis believes this completion technique will carry forward regardless of cost increases because it allows operators to use higher volumes of lower-cost sand as proppant. This means they can forgo the more sophisticated ceramic or resin-coated proppants that were designed to enhance conductivity and flow. For the same reason, basic slickwater formulas can be used to transport the sand vs. the more expensive crosslink gels and hybrid fracturing fluids needed to carry proppant further into the reservoir.
And when operators speak of high-grading programs, she said it needs to be understood that the definition of what is considered a sweet spot or a core acreage positon is expanding as a result of the new learnings and techniques. In other words, the reservoir rock being drilled out today is not necessarily going to be more productive than next years’ drilling targets. “As operators continue to learn, their portfolio of sweet spots and high-graded acreage has grown too,” Curtis said.