Although the oil and gas industry comprises professionals in diverse disciplines, many of us followed a similar trajectory in our early education. As young students, we may have shown an inclination for math or science before parents and mentors nudged us to pursue a technical career in fields such as engineering, chemistry, geology, or physics.
In these fields, we may also have followed a similar path in our math curricula, starting with algebra, progressing to trigonometry, then advancing to calculus courses. While these courses are important for our day-to-day work, the typical curricula for oil and gas professionals lack an emphasis on statistics.
Compared to calculus, statistics is quite young. Modern calculus begins with the infamous story of Isaac Newton and the falling apple in the 17th century, while what we consider the field of statistics emerged in the 20th century, several hundred years later. In other words, humans developed theories for calculating planetary motion before understanding the practical applications of averages, hypothesis tests, and probabilities.
Statistics remains an underutilized tool in the oil and gas industry. Professionals who want to open new opportunities in their fields and advance their careers may benefit from pursuing a more complete understanding of statistics.
Why Are Statistics Necessary?
For oil and gas professionals, there are a number of pressing reasons to continue studying statistics.
- Statistics are the foundation of data science, an emerging skill increasingly expected of industry professionals.
- The digitalization of assets is producing more data more quickly than ever.
- Reservoir evaluation relies heavily on statistical concepts.
- Economic forecasting leverages statistical concepts.
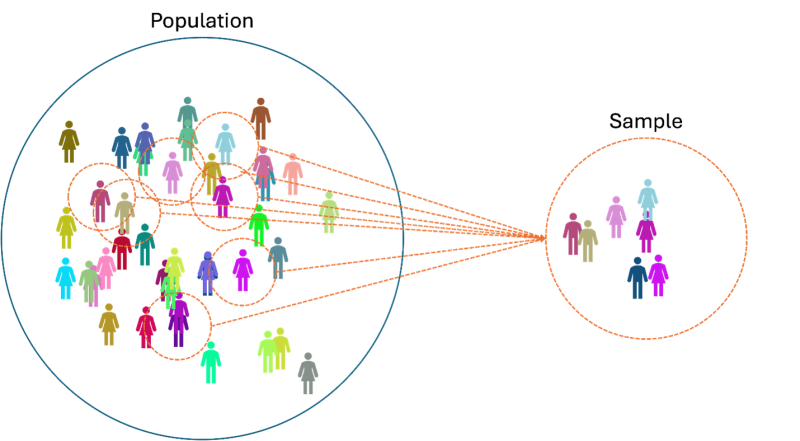
The goal of statistics is simple: To make informed decisions and draw reliable conclusions about a population using data from a sample (Fig. 1).

Is the Source Reliable?
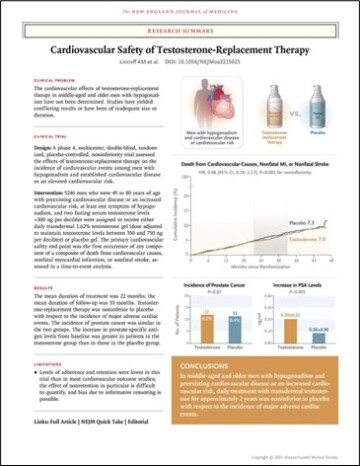
Few oil and gas articles use statistics as effectively as medical studies, so an article (Fig. 2) from the New England Journal of Medicine is a good starting point to introduce key statistical concepts (Lincoff, et al., 2023). The following article investigates the cardiovascular safety of testosterone-replacement therapy in middle-aged and older men with hypogonadism (low testosterone).

An important first step is to confirm that anything you are reading is from a reputable source, especially if using the information as a reference for decision making. Peer-reviewed journals and other reputable publishers such as government and international organizations and agencies are good sources.
How Is the Study Structured?
Beyond who is publishing the study, the next question is how the study is structured.
The methods section of this example study states:
In a multicenter, randomized, double-blind, placebo-controlled, noninferiority trial, we enrolled 5,246 men 45 to 80 years of age who had preexisting or a high risk of cardiovascular disease and who reported symptoms of hypogonadism and had two fasting testosterone levels of less than 300 ng per deciliter. Patients were randomly assigned to receive daily transdermal 1.62% testosterone gel (dose adjusted to maintain testosterone levels between 350 and 750 ng per deciliter) or placebo gel (Lincoff, et al., 2023).
Multicenter, randomized, double-blind, placebo-controlled, and noninferiority may seem like a dense list of technical adjectives, but each of these designations is important in reducing bias and confounding factors.
One of the most critical aspects to consider in studies is whether they are interventional or observational. In an interventional study, researchers actively test a specific variable (like a treatment or intervention) across different groups to determine its effects. We all know the phrase “correlation does not equal causation,” but a proper interventional study creates a scenario where correlation can be attributed to causation, which is incredibly significant.
In contrast to interventional studies, observational studies do not involve direct intervention by researchers. Instead, they observe and analyze existing groups or situations without manipulating variables. While observational studies can provide valuable insights, especially in situations where interventional studies may be impractical, they are generally considered less robust in establishing causal relationships due to the potential for confounding factors.
This example study meets the criteria for excellent research. It is interventional and it is structured so that it is likely that differences in outcomes between various groups can be attributed to what is being tested and not to an outside factor or bias.
What Is the Null Hypothesis?
Once we understand the study structure, we must understand exactly what is being tested and how the results should be interpreted.
In the example study, the high-level goal was to determine whether there is a difference in the number of adverse cardiac events between a group receiving testosterone-replacement therapy and a group receiving a placebo.
How this is worded is important because it defines the null hypothesis. The null hypothesis is a statement used in statistical hypothesis testing that proposes there is no effect or no difference in a population parameter, or that any observed effect is due to random chance. It serves as a default or baseline assumption, which researchers aim to test against the alternative hypothesis.
Typically, the null hypothesis is the “status quo.” For example, if observing whether there is a difference between various groups, the null hypothesis would say by default that there is no difference.
The example study is explicitly a noninferiority study. The study aims to show that the new treatment is not worse than (or is at least as good as) an existing treatment by more than a pre-specified margin. This is a common medical treatment type of study where it is assumed that there is a difference between the groups and the treatment is assumed to be inferior. For the example study, the null hypothesis is that testosterone-replacement therapy will have an inferior outcome to the placebo group in terms of cardiac events.
Ultimately, the null hypothesis is a reference point for interpreting the results of a study.
What Are P-Values?
After we understand the study structure and the null hypothesis, we can begin to look at the findings and review the statistical analysis. To do that, it is important to understand the central limit theorem (CLT).
The CLT states that, given certain conditions, the arithmetic mean of a sufficiently large number of iterates of independent random variables, each with a well-defined (finite) expected value and finite variance, will be approximately normally distributed, regardless of the underlying distribution (Freeman, 2016).
This is a formal way of saying that despite what the distribution of a particular metric from the population looks like, if we were to continually pull a sample from it and take the average of that sample, we would end up with a normal distribution around the mean. Statisticians like normal distributions because they are easy to work with in terms of extracting probabilities and percentiles.
Fig. 3 shows what happens to an imaginary population of people with a uniform age between 0 and 100. If we then randomly sample that distribution (using 20 people each time in this case) and then take the average, that distribution of sampling means would be normal in its shape.

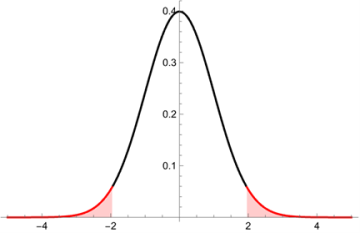
Depending on the study, statistical analysis can become complex; however, the end goal is to determine whether the results from comparisons across the various groups is “statistically significant.” This term generally indicates that the p-value returned from the hypothesis test was found to be less than or equal to 0.05.
The formal definition of the p-value is the following:
The p-value is the probability of observing a test statistic at least as extreme as the one actually observed, assuming that the null hypothesis is true.

Essentially, when analyzing the results of the study statistically, we assume our null hypothesis to be true and then determine the probability of observing the previous outcome under that assumption. The 0.05 threshold comes from the idea that if there is a 5% probability or less of the outcome occurring under the null hypothesis, there is strong evidence to suggest that the null hypothesis is not true.
In the example study, the null hypothesis is that the use of testosterone-replacement therapy is inferior in terms of leading to more cardiac events. The p-value from the study for noninferiority was < 0.001, which means there was overwhelming evidence against the null hypothesis. This indicates a strong likelihood that testosterone-replacement therapy has no effect on cardiac events, which is, of course, good for patients who are interested in the treatment. As the article states:
In men with hypogonadism and preexisting or a high risk of cardiovascular disease, testosterone-replacement therapy was noninferior to placebo with respect to the incidence of major adverse cardiac events (Lincoff, et al., 2023).
Conclusions
In the oil and gas community, growing volumes of data make it increasingly important to understand statistics. If you wish to read and contribute to research, educating yourself in the study of statistics and strengthening your grasp of statistical concepts is a worthwhile endeavor.
Key concepts for reading statistical studies:
- Consider the source of the study, favoring reputable peer-reviewed journals and established organizations.
- Differentiate between interventional studies (which can establish causation) and observational studies (which mainly show correlation).
- Focus on the study structure to assess the quality of the research.
- Understand the null hypothesis, which serves as the baseline assumption for statistical testing.
- Be aware of the central limit theorem and its importance in statistical inference.
- Pay attention to p-values, which indicate the statistical significance of the results (typically using a threshold of 0.05).
For Further Reading
Central Limit Theorem by Michael Freeman.
Cardiovascular Safety of Testosterone-Replacement Therapy by M. Lincoff, Cleveland Clinic, Cleveland; et. al.


