
What Is Data Validation?
Have you ever wondered what if the data set you just analyzed is not valid? You might also then ask what is data validation? The United Nations Economic Commission for Europe glossary on statistical data editing defines data validation as “An activity aimed at verifying whether the value of a data item comes from the given (finite or infinite) set of acceptable values.” Other definitions might be found carrying tasks that are similar to the data validation description, and they are
- Data Profiling
- Data Quality
- Data Cleansing
- Data Extraction and Transformation
In all these definitions, the task is related to a single record, which means it doesn’t refer to the relation between datasets. Many definitions followed this definition. For example, Simon (2013) states that “Data validation could be operationally defined as a process which ensures the correspondence of the final (published) data with a number of quality characteristics.” But the definition that takes into account the communication between the data records on the variable level and on the field domain level is the one adopted by the European Statistical System Handbook—Methodology for Data Validation (ESS 2018): “Data Validation is an activity verifying whether or not a combination of values is a member of a set of acceptable combinations.” Explaining that in oil and gas context, let’s say we are auditing a column that has values for shale volume, the first quality indicator we need to adopt here is the values shouldn’t be more than 1, which comes from our field knowledge; other indicators can be non-null values which is a general data check indicator.
What Are We Looking in Data Validation?
There are several levels of quality checks that target the data at different levels of information. An approach by ESS (2018) will be followed which divides the data into two units of test:
1. IT accepted criteria for data validation and quality:
- File format
- Version
- Name guidelines
- Any other corporation related guides
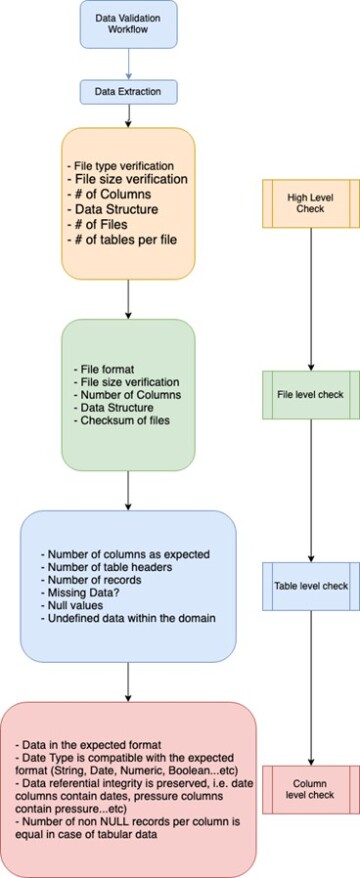
2. Statistical and logical tests for data quality, and these are divided into several subcategories shown in Fig. 1 and explained in Table 1.

These data quality-check levels are explained in Table 1 below:
| Level | Description | Example |
| 0 | Checking the file within the IT and corporation guidelines. | Column separators are valid, number of columns matches the expected number, and column format matches the expected format. |
| 1 | Checking with the elements dataset, if statistical information included in the file. | In this stage you will start implementing your ad-hoc rules, i.e., is the order date always earlier than the shipping date? Is flow value always positive? |
| 2 | Checking the integrity with all similar files but from a statistical point of view. | For a specific field, the descriptive statistics or the 5-numbers summary (Min, Q1, Median, Q2, Max) should be in the same vicinity across multiple files. |
| 3 | Checking the integrity with all similar files from a statistical point of view but from different data sources. | This is similar to item 2 but this time we are checking across different data sources, for e.g., if we have data coming from an SQL server and other data coming from an AWS S3 bucket, these are two different data sources. |
| 4 | Checking data that describes the same phenomenon but from different data sources or domains | E.g., checking the unemployment rate consistency from the register data and from Labor Force Survey |
| 5 | The consistency of the data between different providers. | This is similar to item 2 but here we are checking across different data sources for consistency. Example: “EU road freight statistics are prepared by Member States according to the EU Commission legal acts and in addition countries can carry out specific surveys for national purposes. A benchmarking between indicators common to these different surveys allows assessing the coherence of these data and could help improving the methodologies for data collection” by ESS (2018). |
How Do We Approach the Data Validation Routine?
Since every dataset is a different story when it comes to the check levels mentioned earlier there is no out-of-the-box method to perform these tasks, and some ad-hoc data validation process must be implemented. There are a couple of packages in both Python and R for this purpose, and it is also possible that these checks can be implemented using the in-house data analysis tools.
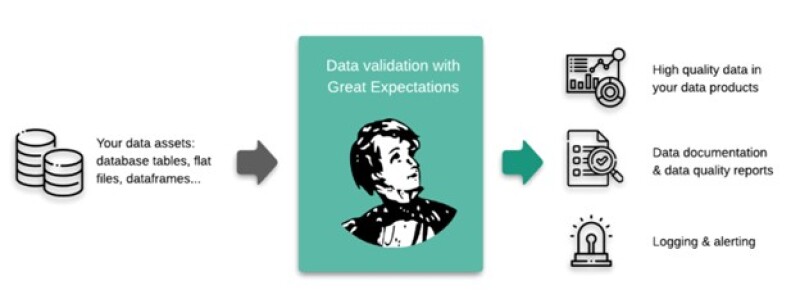
a. Python packages (Great Expectations): This is one of the famous packages in Python which comes with many validation check points and users can also create their own check points. This library can be implemented to be a part of any data pipeline and the input data will be profiled accordingly.
b. R Packages: The “Validate” package of R has many ways of implementing checks on different levels.
Below is a flowchart that represents the logical flow in data check tests in an oil and gas dataset. Note: Depending on the use case not all checks levels are implemented.
Oil and gas use case:
| Data file | .LAS files came from several service companies from wells in the same field. |
| Variables included | Gamma Ray, Line Tension, Depth, CCL |
Data quality procedure:
As we pointed above not all data quality levels can be executed depending on the use case. We will reuse the table above and add an extra column that explains the action we took in this check level.
| Level | Description | Example | Action taken |
| 0 | Checking the file within the IT and corporation guidelines. | Column separators are valid, number of columns matches the expected number, column format matches the expected format. | Check the .LAS files for integrity, delimiters, well info, and curves names match operator guidelines. Usually this step mostly depends on the posted guidelines by the client. |
| 1 | Checking with the elements dataset, if statistical information included in the file. | In this stage you will start implementing your ad-hoc rules, i.e., is the order date always earlier than the shipping date? Is flow value always positive? | This step needs some domain knowledge, for e.g., is the depth always increasing? Is the sampling rate or the interval constant? |
| 2 | Checking the integrity with all similar files but from a statistical point of view. | For a specific field, the descriptive statistics or the 5-numbers summary (Min, Q1, Median, Q2, Max) should be in the same vicinity across multiple files. | 5 numbers summaries are generated for these multiple .LAS files and compared together to check if these summaries are in the same range and nothing concerning is observed. |
| 3 | Checking the integrity with all similar files from a statistical point of view but from different data source. | This is similar to item 2 but this time we are checking across different data sources; for example, if we have data coming from an SQL server and other data coming from an AWS S3 bucket, these are two different data sources. | If we have files coming from different data sources, this step will be performed. It’s good to mention here how we define a data source. Is it a different tool? Same tool with different technology? This level overlaps with the next level to a certain extent. |
| 4 | Checking data that describes the same phenomenon but from different data sources or domains | E.g., checking the unemployment rate consistency from the register data and from Labor Force Survey | If we have the same GR measurement but coming from a different tool or from different departments (e.g., reservoir engineering vs. drilling), we can use it as a check in this step. |
| 5 | The consistency of the data between different providers. | “EU road freight statistics are prepared by Member States according to the EU Commission legal acts and in addition countries can carry out specific surveys for national purposes. A benchmarking between indicators common to these different surveys allows assessing the coherence of these data and could help improving the methodologies for data collection” by ESS (2018). | This step will be performed if we have different service companies generating the same measurement for the same well. If that happens a lot in the well’s life, we can use that as a quality check. It also depends on the criticality of the variable and on the technical decision whether to move on and spend time/effort to quality check this variable and what will be the consequences if we moved on without performing the check on this particular variable. |
Sources of Error in Data
Human error: These errors include the misreading and misinterpretation of the data that has been
recorded by field personnel.
Data collection setup error: The way that data is collected might have a probability of error to propagate. Example: The flow rate of four producers is obtained by dividing the total flow rate by four. This assumes that the rates from the four producers are equal, while in fact they most likely are not.
Device malfunction which results in corrupted data: The missing or corrupted data can have an impact on the decisions that need to be made. The error in one data set may propagate to parameters that depend on these data sets.
Final Thoughts
Data validation is not a direct out-of-the-box process; it requires planning and even budgeting. With that in mind, modeling process with high-quality data can save your time, money, and effort. Data validation tests can be integrated to work passively before ingesting the data into the analytic tools or they can be implemented in a way such that they can be integrated easily during any extract-transform-load process.
