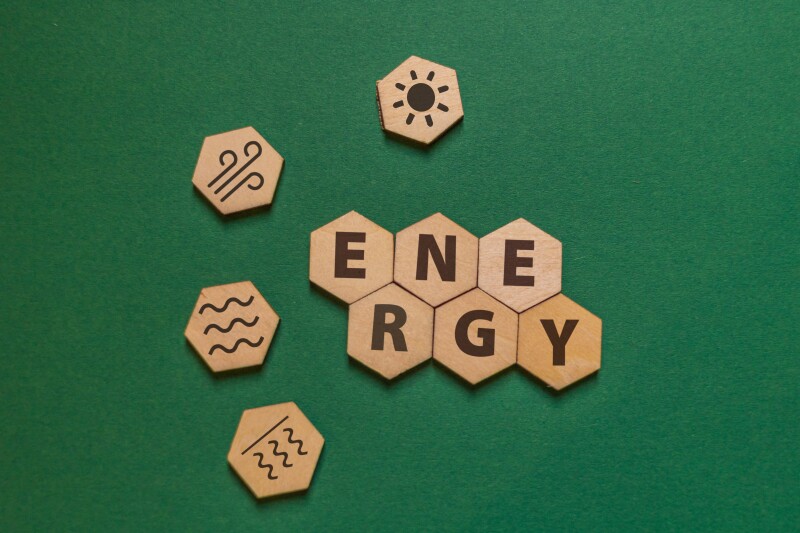
New solar energy installations in the first quarter of 2023 fell 34% year-on-year, as reported by S&P Global Market Intelligence. However, activity is increasing with the passing of the Inflation Reduction Act in August 2022, which provided developers with a decade's worth of certainty that they can count on tax equity in raising cash for new solar energy farms.
Wind power also suffered a decline of 47% from the year-ago period, but the 5-year pipeline for wind power projects increased by 5% from the fourth quarter of 2022.

