Antarctica, the “harsh continent,” is the highest, driest, coldest, and windiest place on Earth. A continent-spanning ice cap belies cold desert conditions under which climate records accumulate with glacial slowness. Antarctica is the storehouse of the world’s oldest ice-borne climate records, preserved in the Antarctic deep freeze for millions of years. But Antarctica is also a living laboratory in which the decadal effects of climate change can be directly observed. Accordingly, Antarctica serves as a valuable scientific resource for understanding past climate conditions as well as for gauging the current trajectory of climate change (Fig 1).
A Lens for Climate Change
Climate information from Antarctica comes from three major sources: the land ice record, the marine (sedimentary) record, and the ecosystem record. Because marine sedimentary records exist at all latitudes, only the Antarctic land ice and ecosystem records will be discussed. Ice cores from interior Antarctica provide a long and continuous record of atmospheric conditions in the southern hemisphere, while ecosystem records give us insight into the response of the Earth’s biosphere, hydrosphere, and cryosphere to ongoing and future changes.
Antarctic Ice Cores: The Long Record of Atmospheric Conditions
The Antarctic ice sheets (east and west) are tremendously large glaciers—bodies of ice deposited snow (<10 cm of snowfall per year is common at the South Pole), that compress under their own weight (Antarctic ice sheets average ~1 km in thickness) and flow slowly toward the sea. At high points on the ice sheets (called domes), the net velocity of ice is downward, perpendicular to the surface of the Earth (rather than subparallel, as in the case of flowing ice away from domes). As a result, ice extracted from domes increases in age with increasing depth. Snow falling on Antarctic domes traps atmospheric gas, as well as dust and other particular matter, producing a continuous record of temperature-dependent snow isotopic chemistry and atmospheric gas composition.
The most common ice core measurements used in climate studies are snow/ice isotope ratios (deuterium to hydrogen and 180 to 160, denoted dD and δ180, respectively when normalized to international standards), dust content, sodium concentration, ice electrical conductivity, ice grain size, and atmospheric gas composition (carbon dioxide, methane, and atmospheric dD and δ180). Dust content is used to estimate paleo-wind intensity (sediments from distant deserts). Sodium concentration and electrical conductivity are used to estimate the contribution of marine aerosols. Atmospheric dD and δ180 are indicators of global ice volume and the state of global hydrological activity.
Snow dD and δ180 vary linearly with the atmospheric temperature at which the snow formed and also with the surface temperature of the precipitation site. This means they can be used to reconstruct a temperature record with time. In particular,
ΔTp = (ΔdDice - 8Δδ180sw)/9,
where ΔTp is the difference between the current temperature at the altitude of snow formation and the paleo-temperature at altitude, Δδ180sw is the global average difference between today’s seawater δ180 and paleo-seawater δ18O, and 9‰ per ˚C is the deuterium temperature-isotope gradient in East Antarctica (Petit et al. 1999). Snowfall atmospheric modeling indicates that ΔTp is approximately 2⁄3ΔTS, the difference between paleo-temperature and modern temperature at the Earth’s surface.
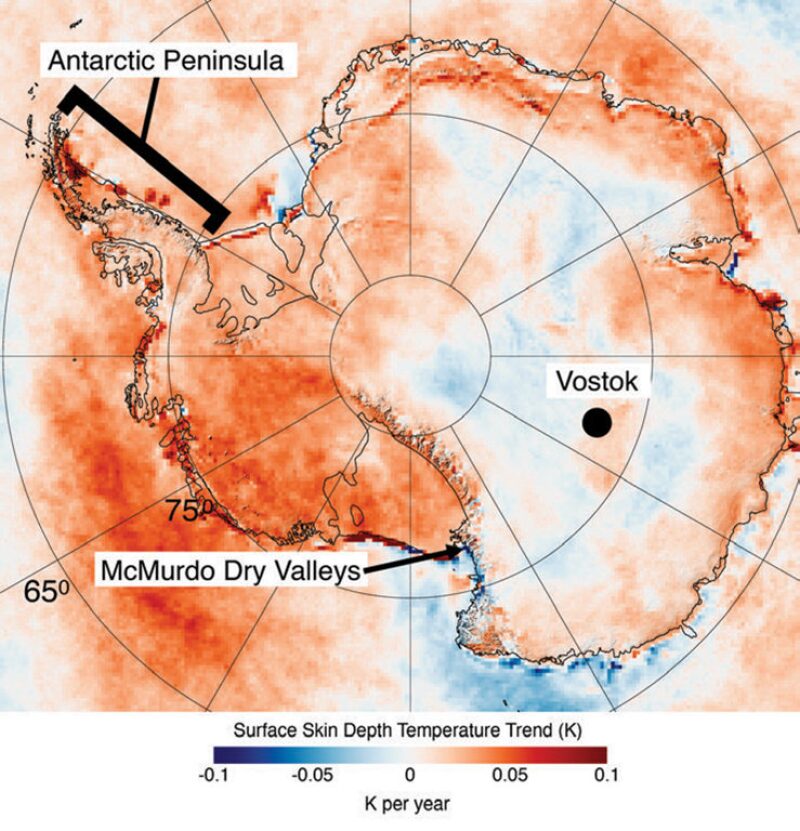
The Vostok ice core is one of the most studied ice core climate records from Antarctica (Fig. 1), and provides a case study in the translation of ice cores into climate data. Vostok station is located near Dome B in East Antarctica (78˚S, 106˚E). The Vostok core consists of 3623 m of ice, spanning ~423 kiloyears (ky). Dating of the ice core is based on an accumulation rate model driven by the temperature-dependence of saturation vapor pressure on temperature at the altitude of snow formation, modulated by an ice flow and thinning model (Vostok is not positioned directly at Dome B), and pinned to two dated core segments at 1534 m and 3254 m that correlate with well-dated marine records. Vostok core dates all have an accuracy better than ±15 ky, better than ±10 ky for most of the record, better than ±5 ky for the most recent 110 ky (Petit et al. 1999).
The Vostok core contains a clear record of the last four major glacial interglacial periods (Fig. 2) [older, deeper ice cores, for example, the EPICA core from Dome C extend back even further]. Glacial/interglacial fluctuations in the measured parameters have a similar cyclicity to marine climate records, suggesting that the four most recent ice ages have been driven primarily by insulation changes associated with the Earth’s orbital eccentricity on a period of ~100 ky (Imbrie et al. 1993). The Vostok record shows that both the succession (timing) and intensity of temperature and atmospheric composition changes are similar through each glacial/intergacial climate cycle, however, the interglacial periods vary in length and temperature evolution.
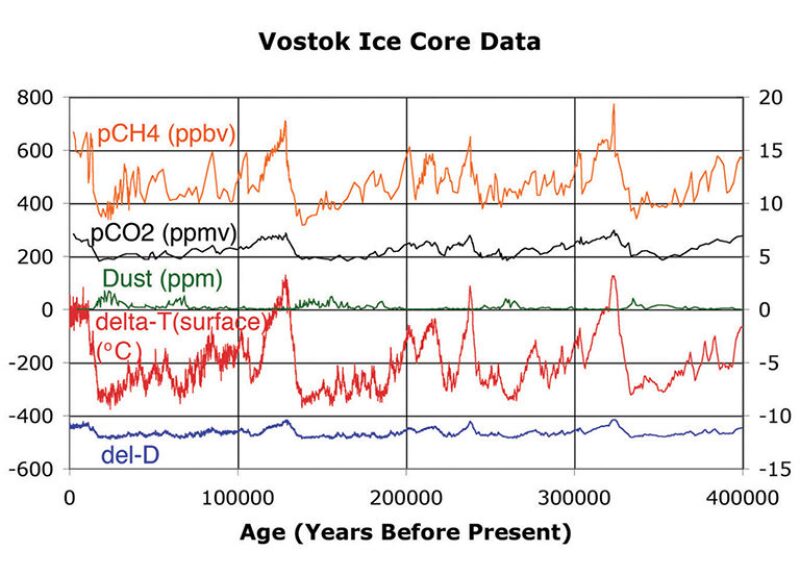
The temperature and chemistry data from the Vostok ice core warrant close examination. The overall surface temperature difference between glacial and interglacial periods in Antarctica is ~12˚C (Fig. 2). The temperature record has a characteristic sawtooth pattern similar to that observed in marine temperature reconstructions. Warm interglacials cool gradually into glacial periods and end with rapid transitions back into interglacial warmth. This pattern is mirrored in CO2 and CH4 concentrations. CO2 and CH4 concentrations decrease slowly to minimum values during glacial periods and increase rapidly during transitions into interglacials. There is a strong correlation between atmospheric CO2 and CH4 concentrations and Antarctic surface temperature in the Vostok core (r2 of 0.71 and 0.73 for CO2 and CH4, respectively) [Petit et al. 1999].
Transitions from the lowest to the highest CO2 and CH4 values occur during glacial to interglacial transitions. For example, the last two glacial/interglacial transitions have been associated with precipitous increases of atmospheric CO2 from ~180 ppmv to ~280 ppmv, and with increases of methane from ~350 ppbv to ~650 ppbv. The maximum CO2 mixing ratio reported in the Vostok core is 298.7 ppmv (Petit et al. 1999). Interestingly, during glacial to interglacial transitions, CH4 and temperature decrease in phase, while CO2 concentration can lag by several kiloyears.
In summary, the Vostok core shows a strong correlation between orbital timescales and climate timescales, and between surface temperature and CO2 and CH4 atmospheric concentration. Earth’s climate system responds to external (orbital) forcing, but atmospheric chemistry modulates and amplifies the temperature and timing response of the climate to this forcing in complex ways.
The Ecosystem Record: Decadal Response
Antarctic ice cores provide a perspective on changing climate conditions over hundreds of thousands of years. However, nobody lives in an ice core. Ultimately, the most important outcome of climate science is being able to predict how changing climate patterns will affect the ecosystems on which human beings depend.
An ecosystem is the assemblage of organisms in an environment coupled with the nonliving components of the environment with which the organisms interact. As is clear from the broad definition, ecosystems typically are extremely complex. The harsh physical conditions in Antarctica significantly reduce the species richness of south polar ecosystems, making them some of the simplest on Earth. The relative simplicity of Antarctic ecosystems, coupled with strong polar sensitivity to climate change, makes Antarctica an ideal laboratory for studying the effects of changing climate conditions on biological communities. These simple systems can serve as models for the warm climate ecosystems upon which human beings most depend.
The southernmost terrestrial ecosystem on Earth is found in the McMurdo Dry Valleys, a series of exposed valleys on the shores of the Ross Sea (77-78˚S, 160-164˚E) that are protected from the impinging East Antarctic Ice Sheet by the Transantarctic Mountains (Fig. 1). The Dry Valleys are a mosaic of glaciers (alpine and outlet), ephemeral streams that flow during high summer, ice-covered lakes, and permafrost. These landforms provide the habitat for a microbially and algal-based food web that supports microscopic soil invertebrates (tardigrades, rotifers, etc.) and that is dominated by nematodes as the top predator. Liquid water is the limiting resource in Antarctic soil ecosystems, while light is the limiting factor in Antarctic lake ecosystems—evidence of their simplicity.
The McMurdo Dry Valleys Long Term Ecological Research project (MCM-LTER, www.mcmlter.org) maintains a network of continuously recording weather stations throughout the dry valleys. In 2002, Doran et al. reported that between 1986 and 1999, the seasonal average air temperature at the centrally located Lake Hoare station had declined by 0.7˚C per decade. This cooling trend has continued in the intervening years, and has been observed at most of the weather stations. Cooling in the dry valleys stands in stark contrast to global temperature trends, which have increased by 0.19˚C per decade (based on 1979–1998 measurements), and amplified warming along the Antarctic peninsula by ~2˚C between 1950 and 2000 (Ducklow 2007).
Dry valleys cooling is most notable during the summer and autumn months (December–February, March–May, respectively), which coincide with the months of peak ecosystem functioning (the only months when day-average air temperatures rise above 0˚C). From 1986 to 1999, summer and autumn seasonal mean air temperatures cooled by 1.2˚C per decade and 2.0˚C per decade, respectively. Perennial lake ice in the dry valleys has increased in thickness by 11 cm per year on average during the cooling phase (Doran 2002).
The response of the dry valleys biological communities to changing climate conditions has been rapid and severe. During the 1986–1999 cooling phase, thickening lake ice reduced summertime photosynthetically active illumination of Dry Valleys lakes, reducing depth-integrated primary production in the lakes by 6% to 9% annually. In the soil environment, the effects of cooling air temperatures on soil temperature and soil moisture resulted in a reduction in invertebrate populations of >10% per year during 1993 to 1998. These population reductions occurred in experimental plots that spanned the range of elevations, soil moisture conditions, and nutrient levels common in the dry valleys, and affected all invertebrates, from microbovorous organisms to the top predator, the nematode Scottnema Lindsayae.
In stark contrast to cooling trends in the dry valleys, warming along the Antarctic Peninsula is acting as the primary driver of ecosystem change (Ducklow 2007). Since 1950, mean annual temperature along the northern portion of the Antarctic Peninsula has risen by 2˚C, while mean winter temperature has risen by 6˚C (Ducklow 2007). This warming has coincided with decrease in the portion of the year when sea ice is present around the peninsula by 85±19 days per year. As a result of these ecosystem changes, species that rely on sea ice are being displaced poleward and replaced by species that avoid ice. This is illustrated by the displacement of Adélie penguins by Chinstrap penguins. These rapid and at times unexpected ecosystem responses make the Antarctic a critical test bed for models of ecosystem change under future climate scenarios.
The Future
What does the future hold for climate change research in Antarctica? Any climate researcher will tell you that the key to anticipating the future lies in understanding the past. Cooling in Antarctica is driven in large part by continued low ozone levels in the Antarctic stratosphere (ozone is an effective greenhouse gas) [Randel and Wu 1999]. At present, strong circum-Antarctic winds (the South Polar Vortex) trap remaining atmospheric chlorofluorocarbons, reducing stratospheric ozone and promoting cooling. Notably, the South Polar Vortex is deflected southward of the Antarctic Peninsula, explaining in part the dissimilarity in temperature conditions between the peninsula and the dry valleys. Gradual increases in ozone concentrations above Antarctica (repair of the “ozone hole”) will allow warming to spread poleward, likely bringing higher average temperatures to the dry valleys (~2.0 to 3.5˚C by 2100 [Chapman and Walsh 2007]). This change to a warming mode, with weakening circum-Antarctic winds, is analogous to ice-core observations showing increased dust fluxes to the deep interior of Antarctica during warm interglacials.
Warming in the Antarctic will likely bring even greater changes to the dry valley and peninsula ecosystems. These natural laboratories will make a transition from being bellwethers of climate change to laboratories in which models of ecosystem response to climate change will be tested. New, high-resolution analyses of Antarctic ice cores will begin to provide decadal-scale measurements of past climate, bringing the ancient record to life in a form relevant to climate and ecosystem forecasters. Although permafrost geologists are loath to say it, in a warming world, their subject matter is “not a growth industry.” Using the scientific resources of Antarctica to understand past, present, and future changes to the Earth’s climate most certainly is.
References
Chapman, W.L., and Walsh, J.E. 2007. A Synthesis of Antarctic Temperatures. Journal of Climate. 20 (16): 4096–4117. doi: 10.1175/JCLI4236.1
Doran, P.T., McKay, C.P, and Clow, G.D. 2002. Valley Floor Climate Observations From the McMurdo Dry Valleys, Antarctica, 1986–2000. Journal of Geophysical Research 107 (D24), 4772. doi:10.1029/2001JD002045.
Ducklow, H.W., Baker, K., and Martinson, D.G. 2007. Marine Pelagic Ecosystems: The West Antarctic Penninsula. Philosophical Transactions of The Royal Society, Biological Sciences 362 (1477): 67–94. doi: 10.1098/rstb.2006.1955
Imbrie, J., Berger, A., Boyle, E.A., Clemens, S.C., Duffy, A., Howard, W.R., Kukla, G. et al. 1993. On the Structure and Origin of Major Glaciation Cycles. II. The 100,000-Year Cycle. Paleooceanography 8 (6): 699–735.
Petit, J.R., Jouzel, J., Raynaud, D., Barnola, J.M., Basile, I., Bender, M., Chappelaz, J. et al. 1999. Climate and Atmospheric History of the Past 420,000 Years From the Vostok Ice Core Antarctica. Nature 399 (3 June): 429–436.
Randel, W.J., and F. Wu. 1999. Cooling of the Arctic and Antarctic Polar Stratospheres Due to Ozone Depletion. Journal of Climate 12 (5): 1467–1479. doi: 10.1175/1520-0442(1999)012<1467:COTAAA>2.0.CO;2
Joseph Levy is a postdoctoral permafrost geologist at Portland State University in Portland, Oregon.