This article, part two of an article series, presents the workflow of a field development plan (FDP) tailored for petroleum undergraduate students and early career professionals. It focuses on the disciplines of drilling engineering and production engineering.
Part one focused on geology and geophysics, petrophysics, and reservoir engineering. The end of the first stage of FDP is marked by well placement, where reservoir engineers verify and validate the sweet spots based on cumulative recovery. The next disciplines involved in FDP are drilling engineering and production engineering.
After determining well placement, the locations are studied by drilling engineers for well planning.
Geographical Location. The complexity of the well-planning process is governed by many factors. A key factor is the geographical setting of the field, i.e., offshore or onshore. In an offshore field, water depth plays a role in determining the complexity of well planning.
In FDP, onshore and deepwater fields involve a mobile drilling unit that can be mobilized from one location to another which enables wells to be drilled vertically on top of the targets. However, complexities in shallow-water FDPs center around platform-based development and locations surrounding settlements onshore, where the mobilization of the drilling rig is not an option requires directional drilling. Directional drilling encompasses optimization of cluster locations, the inclination of the well profile, and anti-collision. For an onshore field application, directional drilling is required to avoid settlement and water bodies.
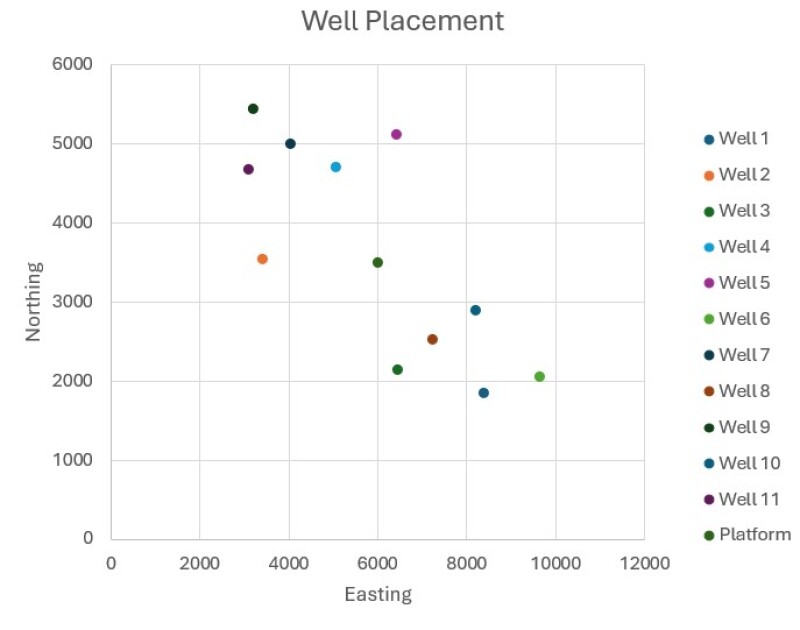
Platform Location/Surface Location. The selection of a platform location/surface location depends on several factors, such as the presence of shallow gas based on pilot-hole drilling, distance to onshore base, measured depth (MD) minimization, inclination, and soil boring test to avoid subsidence. Fig. 1 shows a well placement proposed by a reservoir engineer and repositioning of the platform to minimize MD. The goal of MD minimization is to reduce the total cost per foot of drilling (drilling footage).
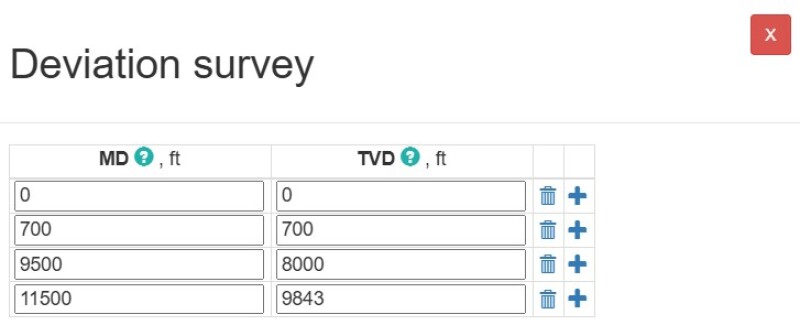
Well Trajectory. The next step is to perform well planning, as shown in Fig. 2, which governs the trajectory of the well drilled from the designated platform. The kickoff point (KOP) is typically located beneath the conductor casing—except in sidetracking scenarios—and is determined according to the stanard operating procesure (SOP), which varies by country. The SOP takes into account the formation strength to ensure a proper kickoff.
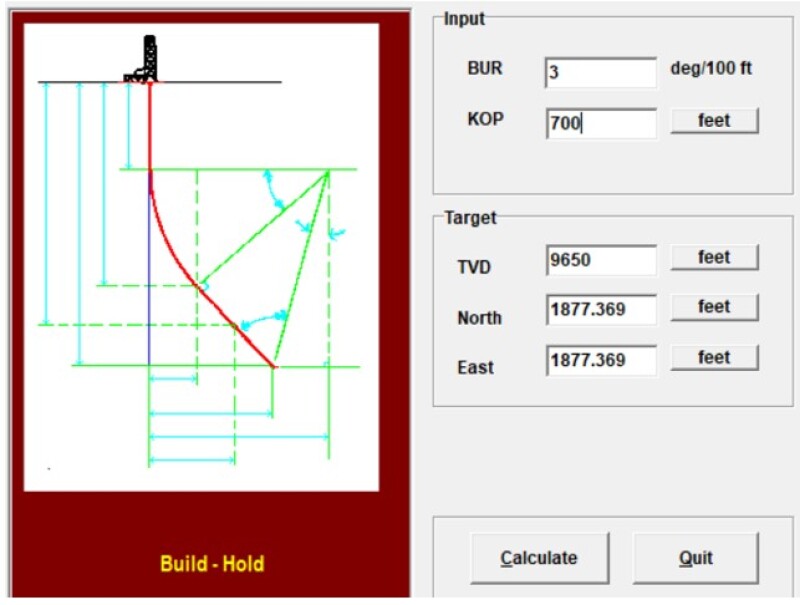
Easting and Northing refer to the distance of the target away from the platform, which is required to construct the trajectory. The rule of thumb is to maintain the buildup rate (BUR) and inclination up to 3°/100 ft, which is also known as dogleg severity, and 60° to avoid buckling and ease wireline running operations, respectively.
Anti-Collision. Anti-collision refers to the error prediction in the measurement by the tool, which must be considered to avoid wells from colliding with each other. The error can be modeled using a different equation by using commercial software and freeware.
The author models the error using the Wolff deWardt Model (Fig. 3).
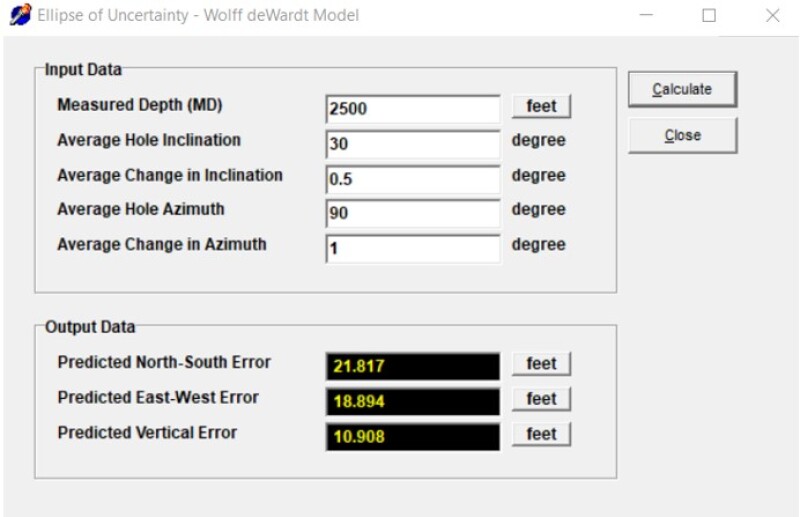
The model yields a predicted error that forms the ellipse of uncertainty, which is then used to compute the separation factor (SF) shown in Eq. 1. The ellipse of uncertainty arises from directional errors in the north–south (NS) and east–west (EW) measurements, which depend on the wellbore’s inclination and azimuth. Because the errors in the NS and EW directions differ, the uncertainty forms an ellipse rather than a circle. The higher the separation factor, the safer the operation.

This article emphasizes well planning and placement in the context of a development phase.
Production Engineering (PTech)
The next stage after drilling is production engineering (PTech), which includes many deliverables, such as drillstem test (DST) matching, nodal analysis, sensitivity analysis, artificial lift, material selection, and flow assurance.
This section focuses on nodal analysis and artificial lift. Well trajectories must be defined in advance, as they have a significant impact on vertical lift performance (VLP) during nodal analysis.
The drilling trajectory is obtained from the drilling engineer. The trajectory input in Fig. 4 is done in a simplistic manner where important points such as wellhead, KOP, end-of-build (EOB), and target are incorporated as an illustration.
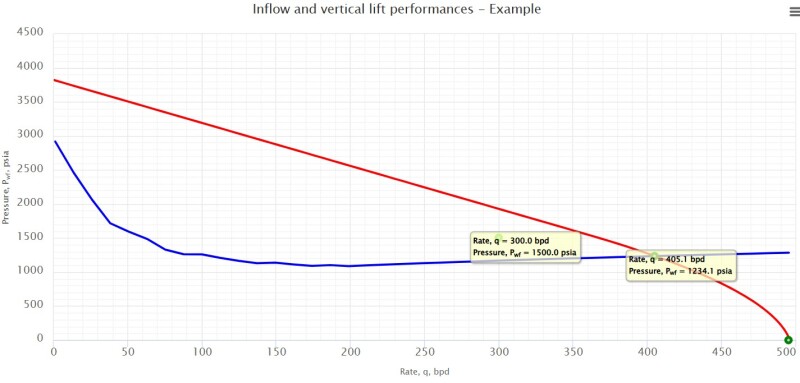
DST is a reference point of well-testing conducted on exploration wells form for nodal analysis. The operating point is the result of nodal analysis where the VLP and inflow performance relationship (IPR) intersect. The reference point refers to the operating point of the DST conducted.
The DST point is shown in Fig. 5. DST matching refers to the iterative modeling of nodal analysis to match the DST reference point, where parameters with the highest uncertainty are adjusted, such as the skin factor (S) used for inflow performance relationship (IPR) or gas/oil ratio (GOR) (for VLP).
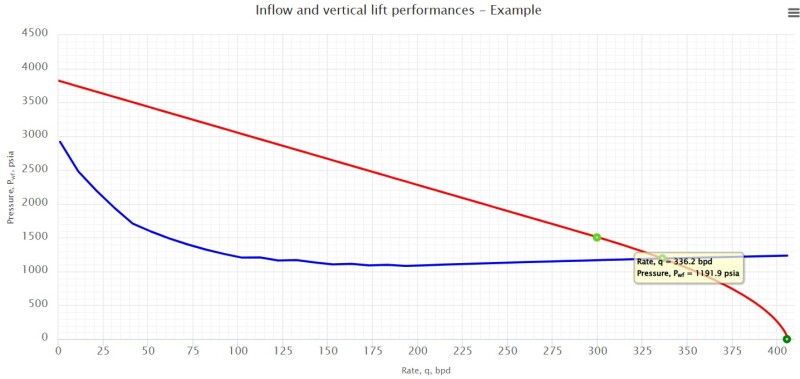
The first adjustment is done on the productivity index (PI), which matched the IPR line to the reference point in Fig. 6.
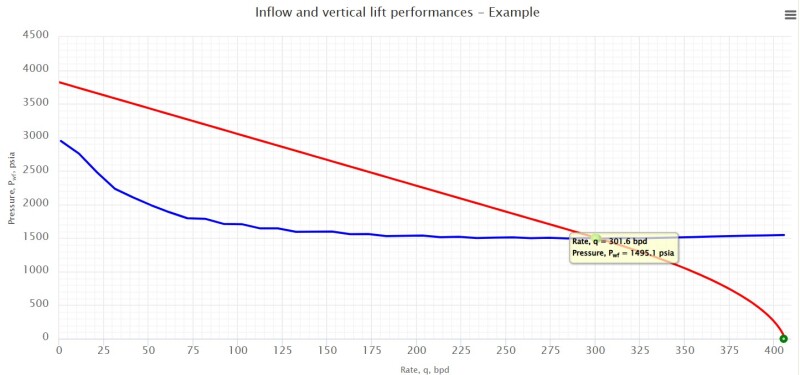
Further matching is done where both the VLP and IPR are matched by tuning GOR (Fig. 7).
Different equations of IPR and VLP may be selected to get a better match. However, in the development stage, the parameters from the development wells can differ from the exploratory wells, such as skin factor, GOR, etc. In FDP, the nodal analysis is done on the proposed development wells. In this scenario, the reservoir properties, such as flow capacity (kh), skin, and GOR, must be changed according to well placement and reservoir dynamics understanding. Flow capacity expressed as kh is a transmissibility term based on permeability (k) and formation thickness (h). Finally, the operating points from the development wells are provided to reservoir engineers to proceed with reservoir simulation with constraints on productivity.
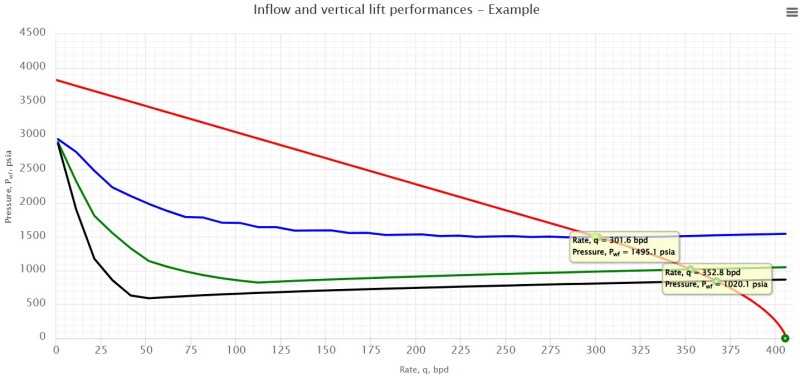
Artificial lift methods are used to improve well deliverability during field development, including techniques such as gas lift, electrical submersible pumps (ESP), and others. Artificial lift reduces the required bottom-hole pressure (BHP) for the well to flow. For example, the implementation of gas lift reduces the density of the oil column in the tubing, which inherently reduces the required BHP. The approximation of gas-lift impact is modeled in Fig. 8, where three different operating points are obtained simulating three different gas-lift injection rates where the highest injection rate is 777 psia while the lowest is 1,234 psia, showing a reduction in the required BHP by almost 500 psi.
The snapshot below shows a session of the author engaging with Universiti Malaysia Sabah students and lecturers, a 2-day FDP training comprising of Drilling and Production Engineering.