
Climate change is one of the most concerning topics in our world today. Carbon capture, utilization, and storage is not the only solution to combat this issue (Nguyen et al., 2021; Olayiwola et al., 2023). There are many new existing and emerging technologies in the campaign to reduce greenhouse-gas emissions such as hydrogen, renewable energy, etc.
While increasing the efficiency of existing oil wells by enhanced oil recovery (Carrera et al., 2023) and maintaining the condition of the wells (Olayiwola et al., 2022a; Nguyen et al., 2022; Mahmood et al., 2023; Olayiwola et al., 2022b), extended-reach drilling activities also play an essential role in making the energy transition smoother by meeting oil and gas global demand.
One of the innovative methods in drilling technology is using a catenary trajectory.
Extended-reach drilling has been studied by many researchers (El Sabeh et al., 2023; Huang and Guo, 2022; Hussain et al., 2021). El Sabeh et al. reviewed the issues of extended-reach drilling, including high torque and drag, poor hole cleaning, bottomhole assembly design, and hydraulic and equivalent circulating density (ECD) management, while Huang and Gao (2022) analyzed the drilling difficulty and still emphasized that high friction and drag is one of the biggest challenges. Hussain et al. (2021) introduced the help of technologies to intervene in extended-reach drilling activities, such as using mapping-while-drilling and magnetic-resonance-while drilling services and advanced polyglycol water-based mud systems.
Well reach has significantly increased in the past decade. In the 1980s, a 3-km stepout was common. This increased in the 1990s, and one targeted 10 km as a likely stepout. Ryan et. al (SPE 30451) conducted a review of technology in 1995 and concluded that a 10-km stepout is feasible. This was demonstrated a few years later on Wytch Farm (SPE 59204), where it was also shown that shallow extended-reach wells could be drilled. Mason and Judzis (1998) also thoroughly reviewed and recognized technological constraints for reaching up to 18 km.
Although such reach will require fit-for-purpose equipment, it would be possible in a few years.
This paper presents a 2D model of catenary trajectory design, which is easy and convenient to use. The solutions of the catenary design are in closed form and do not demand thorough numerical estimations. A traditional arc well design is also included to compare the hookload with the catenary trajectory well design.
Catenary Trajectory Design
The catenary trajectory design was first recommended to the oil industry by McClendon and Anders (SPE 13478). Several attempts have been tested, but the method has had limited application. Aadnoy and Andersen (SPE 39391) and (2001) developed the general catenary solution, which is suitable for any inclination. Ma et al. (1998) introduced field cases for catenary wells drilled in China. Torque and drag are always a big concern for all types of extended-reach wells.
Planeix and Fox (1979) published a method to calculate the final angle and direction of a well that turns and builds an angle to reach an expected target from a known surface location. However, their method contains only one turn rate and must decide the turn-end point through calculation. McMilian (1981) implemented a technique for deciding the lead angle to offset the bit-walk effects. Maidla and Sampaio (1989) calculated the bit- walk rate and the lead angle based on a rock-bit interaction. The model was validated with data from 15 directional wells, and the results present that bit-walk prediction was good for most of the well trajectories, but additional field examples are needed to further justify the method.
The above discussion shows that 3D bit-walk paths will not be possible at a fundamental level. A set of characteristic parameter values would determine the shape of a well profile. The crucial point is that the best solution has to include the well friction as the deliberated index. With the catenary shape, a drillstring will have no contact with the borehole wall. Therefore, the drillstring will tend to stand off the borehole wall and the drag and torque can be minimized.
Mathematical Model (Method Description)
In a 2D Cartesian coordinate system, a simple catenary curve can be given as a hyperbolic function.

Where a is the intercept of the catenary curve with the y axis
The vertical displacement V in catenary section can be written in term of horizontal displacement S as the following equation:

Where Vend is the total vertical displacement in the catenary section
Send is the total horizontal displacement in the catenary section.
The curvature of catenary section, C, can be expressed as:

The radius of curvature at top of catenary section, R, can be estimated by:

The build rate of the arc section or at the top of catenary section in degree per 100 ft, B, is:

The inclination angle q can be calculated as:

Where α is slope angle
In a 2D Cartesian coordinate system, the kick of point (KOP) for arc design can be decided by:

Where If is inclination angle at target base; Ii is inclination angle at KOP.
For upper curve section:

Where VD is vertical displacement; HD is horizontal displacement; MD is measured depth.
For tangent section:

For lower curve section:

Results: A Case Study
The data used for designing arc trajectory and catenary trajectory is presented in Table 1 and 2, respectively.


The design for catenary trajectory includes three parts: arc section, catenary section, and slant section. The KOP is required before starting for arc, catenary, and slant-section design. The arc length is calculated based on the radius of curvature and inclination angle at the top of the catenary section. The most complicated design lies in the catenary section where inclination angle, curvature, and radius are in Equations 6, 3, 4, respectively, and are required to design the catenary section. The vertical, horizontal, north, and east displacement calculations, which can be found in the Excel spreadsheet, are also computed to plot the trajectory. The plot of vertical displacement vs. horizontal displacement and north displacement vs. east displacement are presented in Fig. 1 and Fig. 2, respectively.

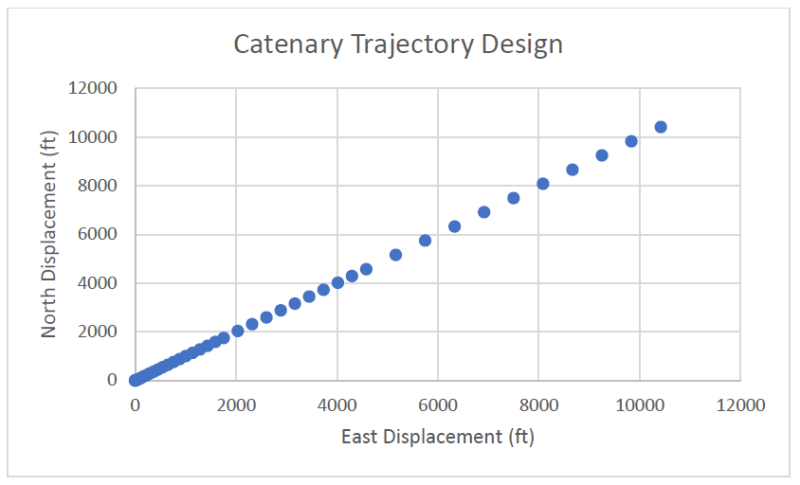
Similarly, the vertical displacement vs. horizontal displacement and north displacement vs. east displacement are presented in Fig. 3 and Fig. 4, respectively.


To have a better observation, the data of two design methods is plotted together to compare as shown in Fig. 5 and Fig. 6.


Then the total hookload (tension at surface T) analysis between two methods are performed to investigate the reduction of wellbore friction in the catenary design.
For 2D arc design:
The axial compressive force at the heel can be expressed by the following equation:

The axial force in the curve section can be computed as:

The total hookload in Fig. 7 is the combination of axial force in the curve section and vertical force Wv generated by pipe weight:

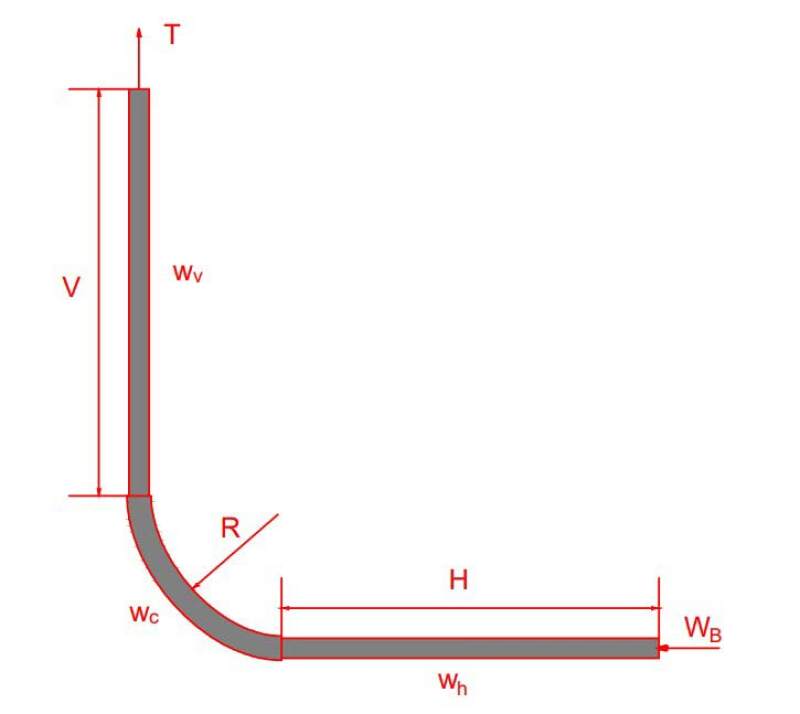
For catenary trajectory design:
The axial compressive force at the heel has a similar expression with arc design:

The influence of catenary shape on axial compressive force at the heel can be expressed as Fct:

The axial force in the catenary can be computed as:

The total hookload is the combination of axial force in the curve section and vertical force Wv generated by pipe weight:

Hookload Analysis for the Case Study
The data for pipe weight and friction coefficient is given below in Table 3 to calculate the hookload.

The calculation is summarized in Table 4.

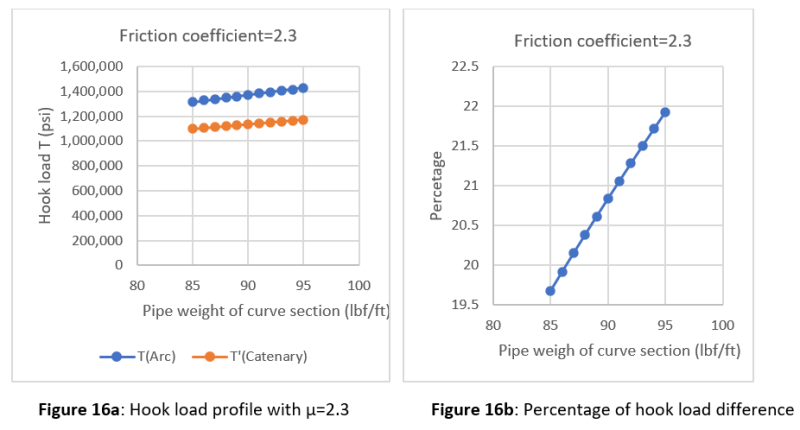
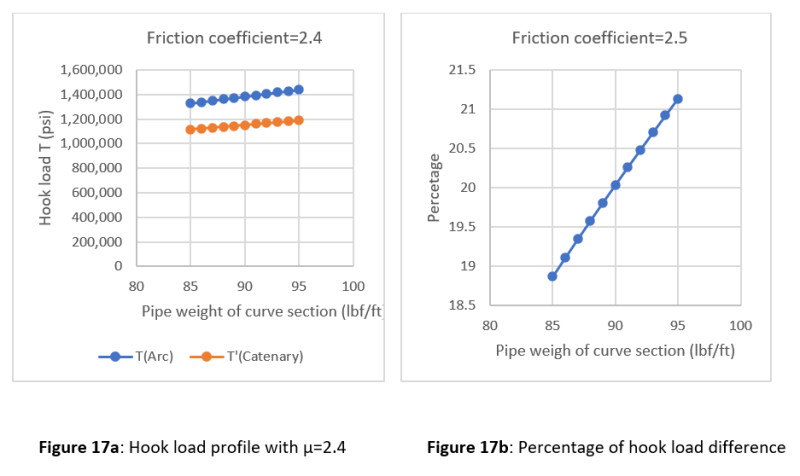
Sensitivity Analysis
Two uncertain parameters can be varied. They are pipe weight and friction coefficient. The pipe weight of the curve section differs from 85 to 95 lbf/ft, while the friction coefficient of the horizontal section ranges from 1.5 to 2.5. The increase in friction coefficient would cause an increase in hookload. In fact, with the pipe weight = 85 lbf/ft and friction coefficient=1.5, the total hookload for catenary design is about 956,199 lbf while it is approximately 973,907 lbf with friction coefficient = 1.6. Also, the total hookload would increase with the increase in pipe weight. The total hookload varies from 956,189 to 1,027,789 lbf in the range of pipe weight of the curve section from 85 to 95 lbf/ft. The total hookload plots with different friction coefficients and pipe weights are presented in Figs. 8 to 18.


Discussion
Based on Fig. 6, the two methods have a similar profile of north displacement vs. east displacement because they have similar horizontal displacement. The difference in vertical displacement would create a distinction between the two methods.
The total hookload for arc trajectory design is 1,352,236 lbf which is far greater than the total hookload of catenary trajectory design (1,092,633 lbf). Based on the outcome from Table 4, the hookload difference is caused by friction in the curve section. In fact, the axial compressive force in the string at KOP for arc trajectory is 1,270,187 lbf compared to 1,010,575 lb for catenary trajectory design. The difference is 23.8 %.
Conclusions
Several conclusions can be drawn from this study:
- A mathematical model applied for this study is simple and straightforward. It uses closed-form equations and removes the complexity of numerical calculation.
- The difference in vertical displacement would create a distinction between the two methods. This could cause the disparity of total hook load.
- The outcome has shown that catenary trajectory design would reduce the total hook load compared to traditional arc design. The reduction is about 23.8 %.
Acknowledgement
The author is very grateful for Dr. Guo’s instruction to complete this paper.
For Further Reading
SPE 30451 Advances in Extended Reach Drilling—An Eye to 10 km Stepout by G. Ryan, Halliburton; J. Reynolds, F. Raitt.
SPE 59204 To the Limit and Beyond—The Secret of World-Class Extended-Reach Drilling Performance at Wytch Farm by T. Meader, F. Allen, G. Riley.
SPE 48943 Extended-Reach Drilling—What is the Limit? by C.J. Mason, BP.
SPE 13478 Directional Drilling Using the Catenary Method by R.T. McClendon, Dailey Directional Services Inc.
SPE 39391 Friction Analysis for Long-Reach Wells by B.S. Aadnoy, Stavanager University.
Design of Oil Wells Using Analytical Friction Models by B.S. Aadnoy, Stavanger University.
Study on Design of Extended Reach Well Trajectory by S. Ma, Petroleum University.
Use Of An Exact Mathematical Formulation To Plan Three Dimensional Directional Wells by M. Planeix.
Field Verification of Lead Angle and Azimuth Rate of Change Predictions in Directional Wells Using a New Mathematical Model by E.E. Maidla.
Well Cement Degradation and Wellbore Integrity in Geological CO2 Storages: A Literature Review by V. Nuygen, University of Louisiana at Lafayette; O. Olayiwola, University of Louisiana at Lafayette.
Prior Assessment of CO2 Leak Rate Through Cracks Sealed by Nanoparticle Gels by O. Olayiwola, University of Louisiana at Lafayette; V. Nuygen, University of Louisiana at Lafayette.
Impacts of Asphaltene Deposition on Oil Recovery following a Waterflood—A Numerical Simulation Study by M. Carrera.
Experimental Investigation of Nanosilica Gel Properties for Well Integrity Remediation by O. Olayiwola, University of Louisiana at Lafayette; V. Nuygen, University of Louisiana at Lafayette.
Investigation of Nano-Silica Solution Flow through Cement Cracks by V. Nguyen, University of Louisiana at Lafayette; O. Olayiwola, University of Louisiana at Lafayette.
Flow Behavior of Nano-Silica Solutions in Cement Cracks/Fractures by M. Mahmood.
The Application of Nano-Silica Gel in Sealing Well Micro-Annuli and Cement Channeling by O. Olayiwola, University of Louisiana at Lafayette; V. Nuygen, University of Louisiana at Lafayette.
Extended-Reach Drilling (ERD)—The Main Problems and Current Achievements by K. El Sabeh.
Analysis of Drilling Difficulty of Extended-Reach Wells Based on Drilling Limit Theory by W. Huang.
Enabling Technologies Help Drilling an Extreme ERD Well on Brage Field, North Sea by S. Hussain.
