

In constructing type well profiles (TWP) for oil and gas production, the traditional approach has relied on decline curve parameters to create a "best fit" for average historical production. While this method served the industry well, it inherently simplifies the nonlinear behavior of unconventional reservoirs and creates limitations (SPE 158867).
With advancements in the use of artificial intelligence (AI) models to predict future production, this best-fit simplification is no longer necessary. As the industry shifts to tighter well spacing and the development of Tier 1a and Tier 2 rock, leveraging more data to create production forecasts becomes increasingly critical.
AI-based forecasting, coupled with percentile-based methods, such as P10/P50/P90 analysis and distribution plots, enables a more comprehensive view of production variability and uncertainty. Together, AI models and probabilistic outputs provide a reliable alternative workflow to traditional best-fit decline curve approaches for type well construction.
Traditional Curve Fitting and Its Limitations in Unconventional Reservoirs
Historically, TWPs have been constructed by aggregating production histories from relevant analog wells and creating a decline curve that best fits the combined production data. This curve, expressed through Arps or multi-segment Arps formulas, is based on a physical description of the reservoir and represents the final output used in economic evaluations and forecasts. Industry norms have long relied on this workflow, which provides a streamlined and standardized approach to forecasting.
However, the accuracy of this best fit can be subjective. Decline curve analysis (DCA) inputs of initial production point, and b-factor and decline percent, both which change several times over the early life of the well, can be estimated as very different values based on the interpretation of the historical and analogue data.
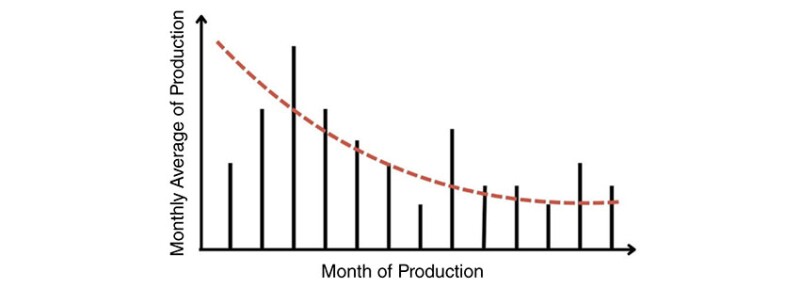
The use of a best-fit decline also smooths out any variation in the actual production, as shown in Fig. 1. This can under- or over-represent production at different points in time, which can have a significant impact on cash flow. This simplification can affect decisions made by other members of the asset team who rely on these forecasts for planning and investment.
Percentile-Based Analysis: A Better Alternative
One evolution of best practices has been the use of percentile-based approaches, previously not traditionally embedded in unconventional workflows due to computational demands. Percentile-based approaches, such as the Modified Time Slice method (SPEE Monograph 5), address some of the limitations of traditional DCA by incorporating probabilities associated with higher or lower production outcomes.
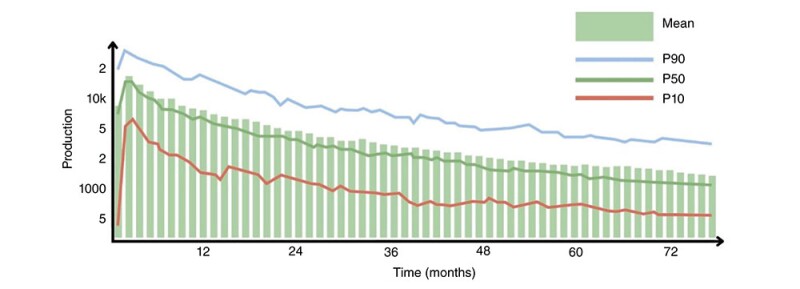
As illustrated in Fig. 2, the Type Well Profile includes a percentile-based view of production forecasts for a TWP. Each month has an individually calculated mean (solid green bars) and percentile forecasts: P10 (solid blue line), P50 (solid green line), and P90 (solid red line). These values are derived from actual production history and AI‑modeled well forecasts. Calculating the modeled percentile forecasts allows practitioners to screen low and high outcomes, rather than a single deterministic curve.
While the Modified Time Slice Method improves upon traditional approaches by incorporating uncertainty, it still relies on time-shifted best-fit forecasts of individual wells. This can introduce biases, particularly in reservoirs with high variability, and often requires manual assumptions about probability distributions. To overcome this limitation, a more robust approach asks practitioners to predict each well's performance separately before aggregating them into TWPs, allowing natural uncertainty to emerge from the data rather than imposing predefined distributions.
Tangible Impacts of Using AI To Improve TWP Development
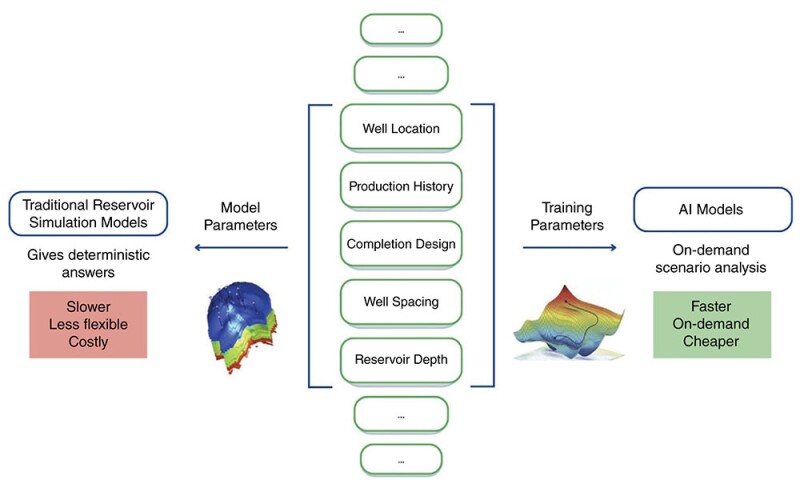
The integration of AI in TWP development represents a major advancement over traditional methods. Monte Carlo simulations and physics-based reservoir models, which are typically expensive and time-consuming to implement, depend on manually defined input distributions and assumptions about reservoir properties. In contrast, AI models leverage a broader range of geological, completion, and operational factors, capturing complex interdependencies to produce more accurate, data-driven forecasts that enhance type well development (Fig. 3).
A few of the concrete advantages of using AI models to do forecasting include:
- Accurate Short-Term Forecasting—DCA struggles in the first 1 to 24 months when production is highly nonlinear and b-values are changing, obscuring critical variations during the most volatile phase of a well’s life.
- Reproducible Answers—Traditional curve fitting introduces variability based on who is performing the analysis. Pure data-driven forecasts ensure consistent, repeatable results.
- Better Analog Well Selection—AI systematically analyzes vast datasets using statistical methods, offering a more objective and consistently applied approach to identifying relevant analogs, which can complement the insights of experienced professionals.
- Full Probabilistic Forecasting—Unlike DCA’s single best fit curve, AI models generate forecasts across a full probability distribution, explicitly quantifying uncertainty akin to Monte Carlo simulations.
- Adaptive Learning through Periodic Updates—AI models are periodically updated with new operational data and benefit from advancements in AI technology. This allows for the iterative refinement of forecasts, ensuring they remain relevant as field conditions evolve over time.
Note that AI-driven forecasting does not replace the expertise of engineers and asset teams. Instead, it serves as a decision-support tool, enhancing traditional workflows by providing a more data‑driven and probabilistic view of well performance. AI helps reduce uncertainty, but human judgment remains crucial in interpreting and applying these insights effectively.
AlphaX Sky: An Out of the Box Solution for Modern Forecasting Needs
Best practices evolve as new technologies redefine what is possible. By incorporating AI and percentile-based forecasting outputs into cash flow models, decision-makers can reduce uncertainty, increase deal velocity, improve the accuracy of early production forecasts, and better manage their assets.
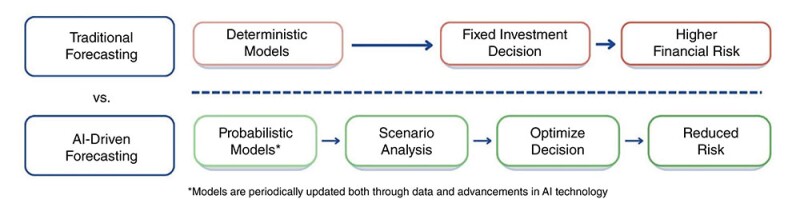
AlphaX Sky operationalizes these advancements by combining basin-specific AI models with traditional workflows (Fig. 4), enabling teams to evaluate a range of scenarios and balance risk with opportunity. By combining statistical rigor with real-world usability, Sky empowers practitioners to make more informed, data‑backed decisions—an essential step in maximizing asset value in an increasingly complex, data‑driven industry.
The Modified Slice Method adapts the 2012 Time Slice Method, which sorts monthly production rates across wells and calculates percentile rates to construct type wells. The modified approach addresses several identified issues by incorporating untruncated forecasts—a key departure from the original method.
The workflow begins in a manner similar to production averaging: identifying suitable analogs, forecasting untruncated production, and time-shifting wells to a common reference. Instead of averaging rates, it calculates production rates reflecting desired exceedance probability values for each time period, using either continuous distribution fitting, discrete data selection, or interpolation between closest values.
The resulting profile is then parameterized with sound judgment to create a TWP whose technical estimated ultimate recovery (EUR) matches the target percentile EUR, which is especially important when working with small or heterogeneous datasets.
For Further Reading
SPE 155947 A Practical Guide to Unconventional Petroleum Evaluation, 2012 by Boyd Russell, Randy Freeborn, and Wayne Keinick.
SPEE Monograph 5. A Practical Guide to Type Well Profiles (First Edition, December 2024). Society of Petroleum Evaluation Engineers

Aruna Viswanathan is co-founder/COO of AlphaX Decision Sciences (AI for upstream O&G). Her background includes engineering (AMD, Motorola), venture capital, and tech acceleration. Prior to AlphaX she was chief underwriting officer/co-founder of private equity group Clearspring Capital with multiple exits to Fortune 500 companies. She holds a BS/MS in electrical engineering from UT Austin and an MBA from Rice University. She currently serves as a director of SPAC Texas Ventures and advisor to Ecosphere Ventures, University of Houston Board of Visitors, and UT Austin’s Texas Innovation Center.

Deb Ryan has more than 20 years of expertise in reserves and resource estimations, A&D, SEC, and PRMS standards, fair market valuation, and reserves audits. Her career includes technical and leadership roles with S&P Global, Sproule, MHA Petroleum Consultants, Arrow Energy, and Woodside Energy. Ryan holds a BS in chemical engineering and an MS in petroleum engineering from Curtin University and an MBA from Penn State. She is a member of SPEE, a former SPE International Board Member and North American Regional Director, and serves on the faculty at CU Denver Business School.