Editor’s Note: This is a summary of the January episode of the President’s vodcast. We encourage you to watch the episode to see the full conversation.
Introduction
Publication quality was one of the 2025 topics I discussed in my September 2024 JPT column. While I believe we can be proud of the best of our publications, generally strengthened by rigorous peer review, I also believe we have a serious problem with the quality of, let’s say, our lowest quartile, and maybe more.
Until recently, we could live with this, i.e., use the best and ignore the rest. But now we are applying generative AI to all our content to fine-tune energy large language models (ELLM). What are the impacts of a “heterogeneous” publication quality (if such heterogeneity is confirmed) on the resulting ELLM?
Originally, I wanted to dedicate a single column to the issue of publication quality. But as I was researching, I realized this topic deserves two columns—one to present the issues and another on the possible paths to address these issues. The time interval between these columns will be used to consult groups and individuals who know the SPE publication aspects better than I do, and who would likely be part of any solution.
I know it is subjective, but we have all heard comments like the one below from an “interlocutor” (albeit a friend of mine who feels comfortable enough to be brutally blunt).
“The quality of SPE papers is going down the drain. There is no bottom. I have given up on going to technical sessions as well. Nothing is comparable to the situation when I joined the industry. There are too many events and publications. And worst of all, however bad a paper is, it will find an event to be accepted and make it to OnePetro. We have lost our way.”
I confess that such comments generally come from senior members. Sometimes, I catch myself thinking along these lines, although I should know better. This can be heard at the SPE Annual Technical Conference and Exhibition (ATCE), our flagship technical event once the holy grail for any member to publish his or her work. Even SPE’s peer-reviewed papers do not escape the wrath of our most critical members.
When digging a bit, my interlocutor acknowledges that there are still good works published by SPE, sufficient to make our industry move forward. However, these papers are (and I quote) “drowning in an ocean of mediocracy!”
So, are we that bad, or is this just the complaint of grumpy old members missing their glory days? After all, our younger members, who have no such reference points, seem to be reasonably happy with what we deliver.
As for my discussion on governance last month, any discussion on publication quality is, up to a point, a subjective topic, and it is not about looking at individual papers and pointing fingers at their authors. After all, if we set the bar too low, we cannot criticize our members for not jumping high enough.
We can only acknowledge a common perception of declining publication quality. To confirm or challenge this perception, we must have metrics. Let us look at the “exact” numbers of our publications and factor in the evolving size of our membership.
I put “exact” in quotes because the oldest papers are over 100 years old, and we may have lost some collective memory. For example, all papers published between 1920 and 1950 are listed as peer reviewed. There may have been a systematic peer-review process at the time, or maybe non-reviewed papers just went into oblivion. Relevant information in our publications has only been reliable for the past 60 years.
1. Statistics on OnePetro and Peer-Reviewed Papers, and Membership
Any member who followed the evolution knows there has been an inflation in the number of events and publications. You only need to check recent SPE communications to know this. My MS thesis was presented in 1984 at the SPE California Regional Meeting as SPE Paper 12778 and later published in September 1988 in the SPE Formation Evaluation Journal. The highest index for an SPE paper is almost 225,000, while we don’t have more than 200,000 SPE papers in the archive, we do have more than 100,000 SPE/AIME papers in the OnePetro archive.
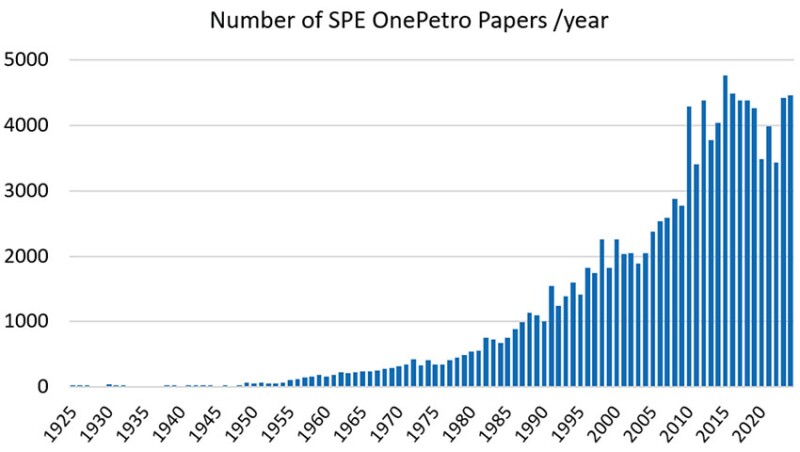
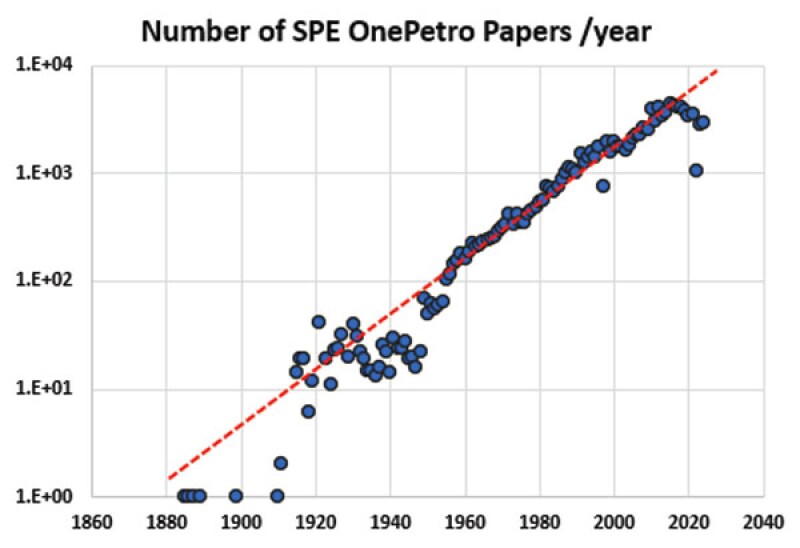
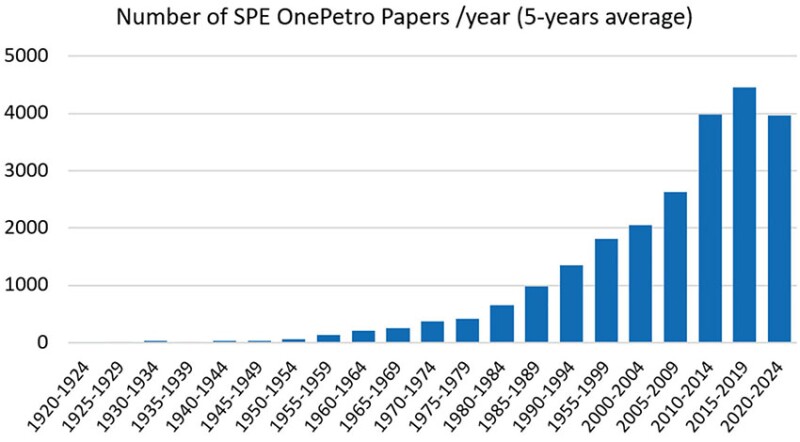
To begin, let’s look at our yearly publication of papers that reach OnePetro. Fig. 1a shows this evolution on a year-on-year basis, whereas Fig. 1b shows a near-perfect exponential trend in publications year-on-year (which is a consistent observation in publication counts across scientific and technical literature). Fig. 1c provides running 5-year averages, which may help to visualize the ever-increasing trend.
Today, most papers reaching OnePetro have gone through a selection process by the technical program committee for a given event, where the process begins with an abstract based on which the selection takes place. Then some events have a “submission review” by the session chairs and/or selected committee members. The paper is then delivered to SPE and is processed by staff to detect commercialism and plagiarism. Finally, the paper is presented at the event. There is a “last chance” after the event to submit a revised version of the paper before consideration in the peer-review process (if the author elects peer review).
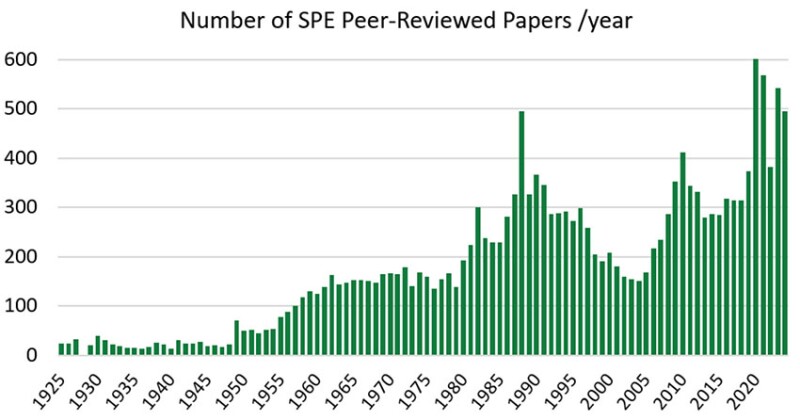
Another important statistic is the number of peer-reviewed papers. After submitting and presenting an SPE conference paper, the author(s) must decide whether to submit their paper for peer review. This is a relatively recent development as historically all SPE conference papers underwent peer review, but the volume became untenable. Once submitted for peer review, the “clock starts,” and a review is provided to the author in 60 days or less. If the paper completes peer review, it then goes on to publication (e.g., the SPE Journal). Note: Obviously, there is a phase during peer review where the author(s) address questions/requirements from the reviewers and editors, and there is an appeals process for papers initially declined.
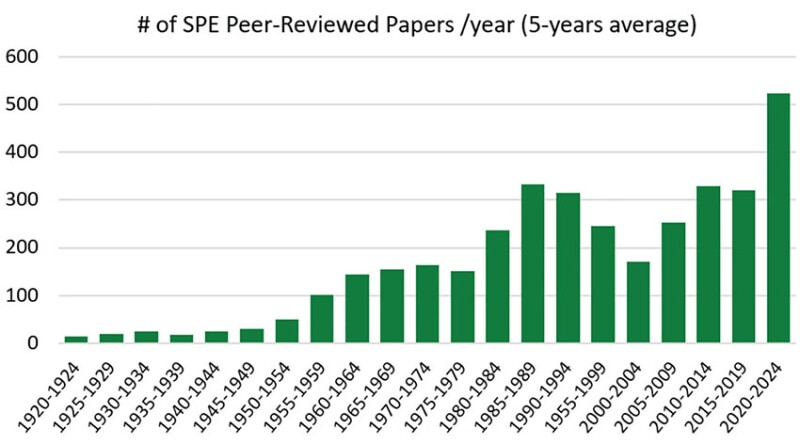
The statistics on peer-reviewed papers are shown in Fig. 2a with 5-year averages in Fig. 2b. We can see a recent surge of peer reviews, which may be linked to the recovery from the pandemic or is simply related to the industry’s recovery (analogous to the 2005–2015 period).
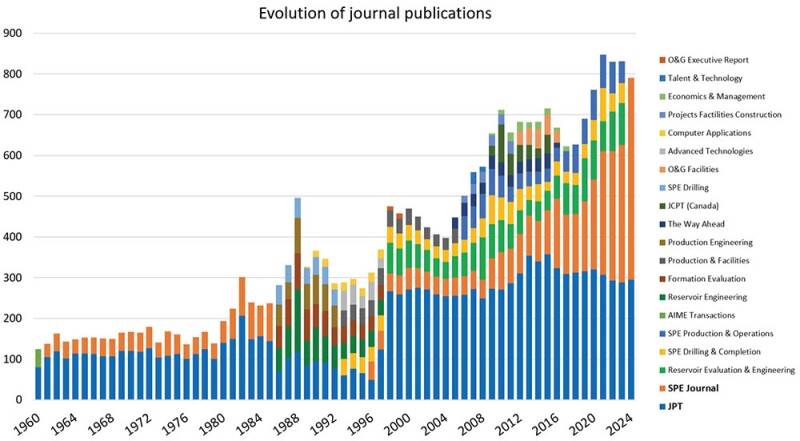
As the name implies, peer-reviewed “journal articles” are published in journals. Fig. 2c shows the evolution of the SPE journal publications over time. Historically, we had only the Journal of Petroleum Technology (JPT) and the SPE Journal. Whereas after 1986, we had several SPE discipline-specific journals as well (one can see the lists of names). In terms of volume, there have been 18,000 peer-reviewed papers between 1920 and 2024; in terms of interpretation, there is no easy way (nor real interest) to de-correlate or decouple increasing content in SPE journals. Also, as of 2024, we are back to only having two journals—JPT for technical articles and synopses of OnePetro papers and the SPE Journal for specific interest and research articles.
Let’s now consider the ratio of peer-reviewed “journal articles” to peer-evaluated “conference papers,” as shown in Fig. 3a as the percentage of peer-reviewed papers, with 5-year averages shown in Fig. 3b. These graphs present a truly remarkable illustration of the evolution of SPE over the past century, including when SPE was just a committee of the American Institute of Mining, Metallurgical, and Petroleum Engineers (AIME).
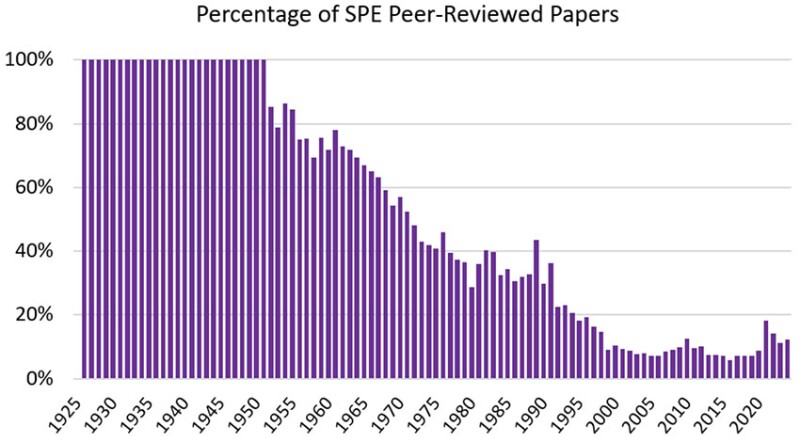
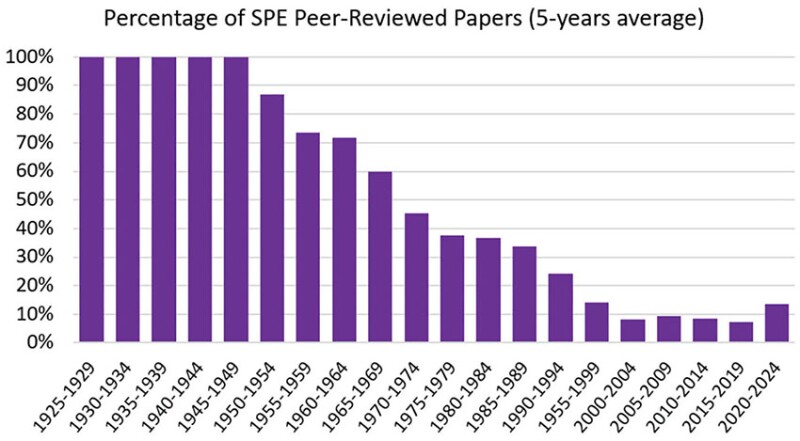
There are many interpretations of the data in Figs. 3a and 3b, perhaps the most important of which is that in the past 25 years, the ratio of journal articles to conference papers is less than 10% (at least until very recently). This low percentage should imply that peer review is working and that journal papers are of a much higher status (hence, quality) as compared to conference papers. However, is this really the case? An equiprobable interpretation could also be that with the proliferation of conference papers, the journal papers will reflect the same “dilution” in quality reflected in conference papers. First and foremost, these are just “counts” (numbers) at present.
In terms of the “decline” in the journal-to-conference paper trend beginning around 1950, we believe that this is due to SPE’s focus on a much wider array of events.
When I started in 1982, the general understanding was that around half of the SPE papers would be peer reviewed. The exact figure turns out to be more like 35% (or about 1 in 3). When I presented my first paper in 1984, it was my MS thesis, coauthored by Roland Horne and Hank Ramey. It was peer reviewed and ended up in an edition of the SPE Formation Evaluation Journal (4 years later). This was a good day for the young professional that I was. I wish this were that “easy” for a YP today.
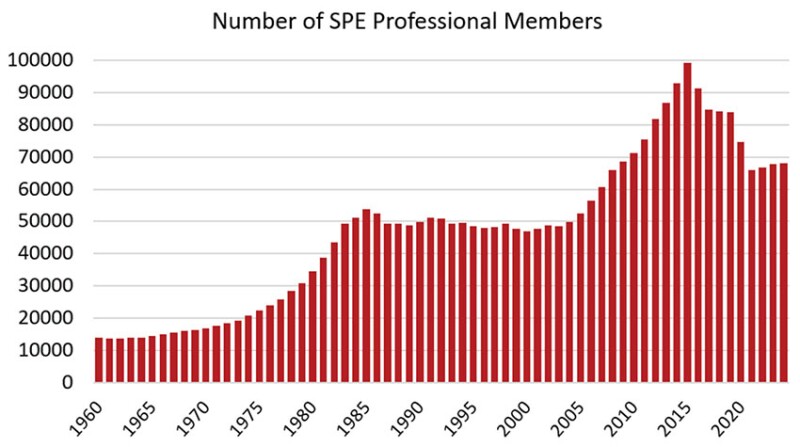
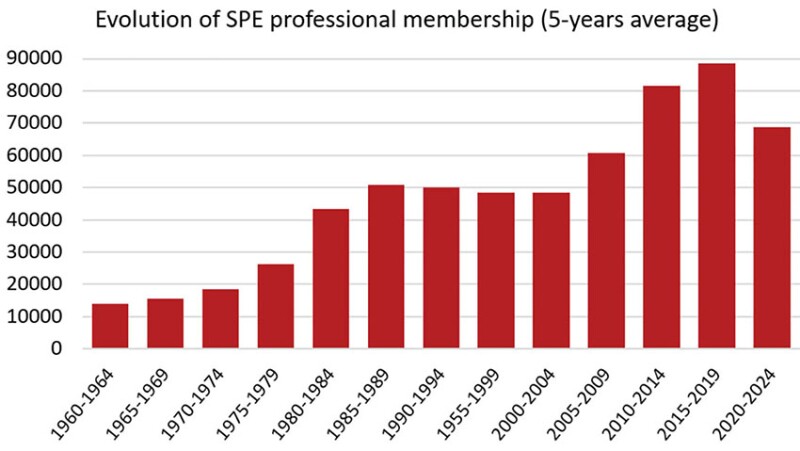
The last statistics I will present (again) are related to the evolution of SPE professional membership (Fig. 4a), with 5-year averages shown in Fig. 4b. They will be used as a normalization factor of the statistics above.
2. Analysis of the Statistics
We have gone back in time as far as we could, and honestly, we cannot (and should not) draw too many conclusions from what we think happened 100 or more years ago. We will now focus on the past 45 years and take the 1975–1979 period as a reference, which is the time when those who have recently retired likely joined the industry. During this time, the ratio of peer-reviewed papers to conference papers was approximately 40%.
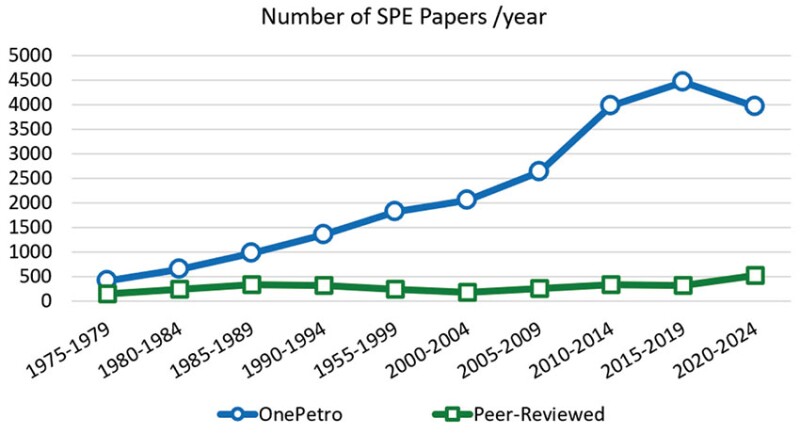
In Fig. 5a, we see the evolution of the number of both peer-reviewed papers and OnePetro papers at large, and we note that there is nothing “obvious” in Fig. 5a, other than the “COVID rollover” (2020–2024) in OnePetro papers and a relatively significant increase in journal articles.
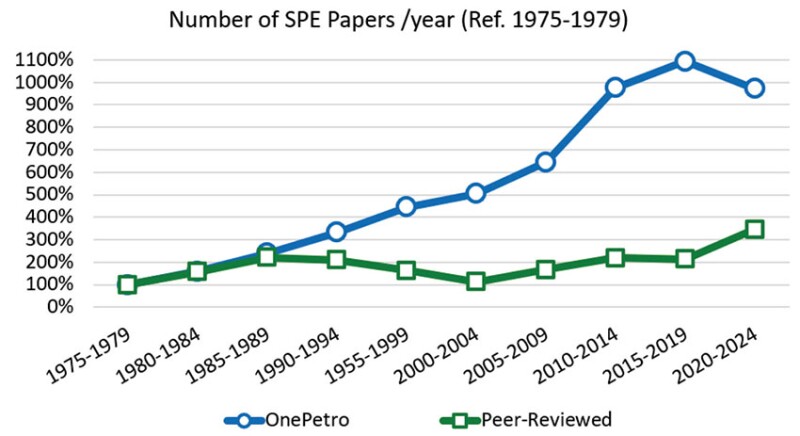
However, in Fig. 5b we normalize both curves with the corresponding numbers for the reference period 1975–1979. The number of OnePetro papers at large was multiplied by 11 before the pandemic and is now back to 10 times post-COVID. Conversely, the number of peer-reviewed papers was multiplied by 2 before the pandemic and went up to a factor of 3 post-COVID.
However, these numbers do not consider the evolution of SPE membership over the same period.
In Fig. 6a, we present the number of SPE papers yearly published per 1,000 members, as the increase in membership could justify a proportional increase in publications without necessarily bringing a reduction in quality.
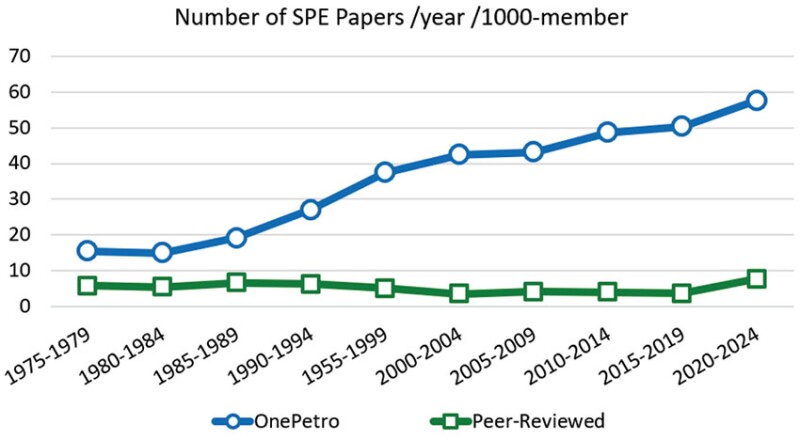
In Fig. 6b, we present the evolution of the number of peer-reviewed papers compared to all OnePetro papers, normalized by the evolution of membership over 1975–1979.
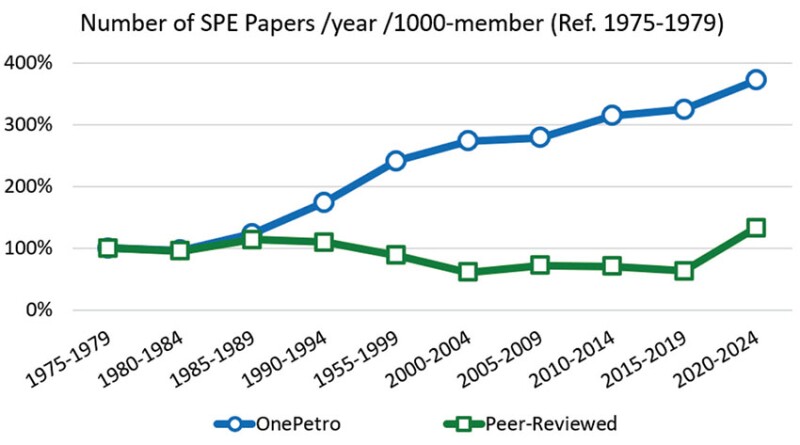
Two clear observations:
1. In 45 years, the number of OnePetro papers, normalized with the number of SPE members, was multiplied by nearly a factor of 4. If we consider that our membership is not significantly less nor significantly more talented than in the 1980s, the publications we produced in the 1980s would correspond to the highest quartile of today’s publications. This also means, unfortunately, that 75% of today’s publications are below, if not well below our 1980s standards for publication. There is a limitation with these sorts of comparisons, but statistics do not lie at this scale.
2. In the past 45 years, the number of peer-reviewed papers, normalized by the number of members has been relatively stable, give or take a recent post-pandemic surge. We may consider that the peer-review process has not significantly changed, but it would point to a stable quality of these papers, with the caveat that selecting candidate papers may be more complicated considering the much higher volume of OnePetro papers.
3. Evolution of Events vs. Evolution of Paper Quality
The massive increase in the number of SPE papers can be correlated to the inflation of events and technical sessions we have seen in the past decades.
These events are also member benefits that have significantly benefited SPE and originated from regional demand from our stakeholders.
Fig. 7 shows the number of events with technical sessions (i.e., where SPE papers are presented). It does not include events such as workshops, forums, and summits, where no paper is presented.
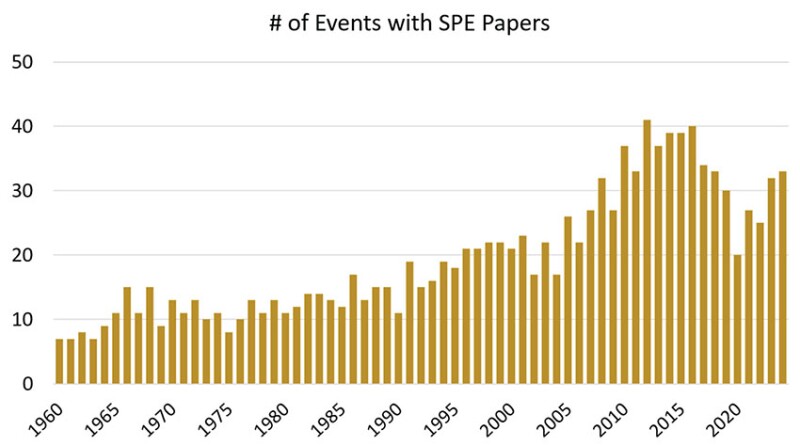
The number of events with papers has tripled since 1980, from around 10 to around 30 per year. This inflation in the number of events also came with an inflation in the number of conference papers per event, as shown in Fig. 8.
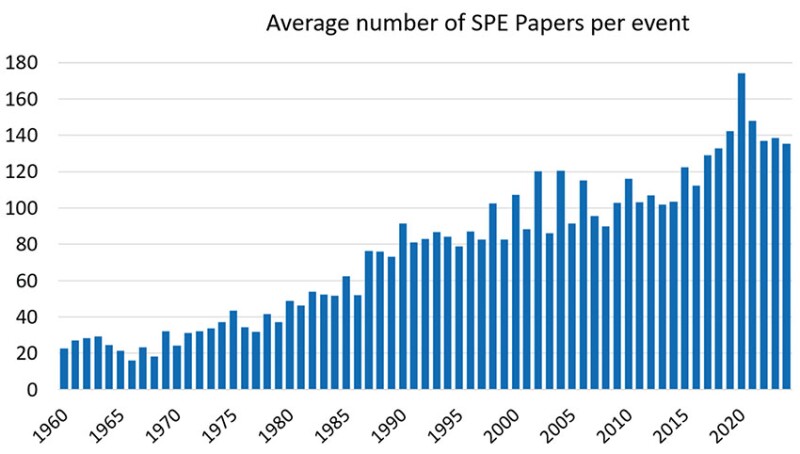
This can be attributed partly to the growth in the size of the individual events. Still, the number of papers per event has more than tripled during the same period, a number consistent with the global 10-fold increase in the number of published papers.
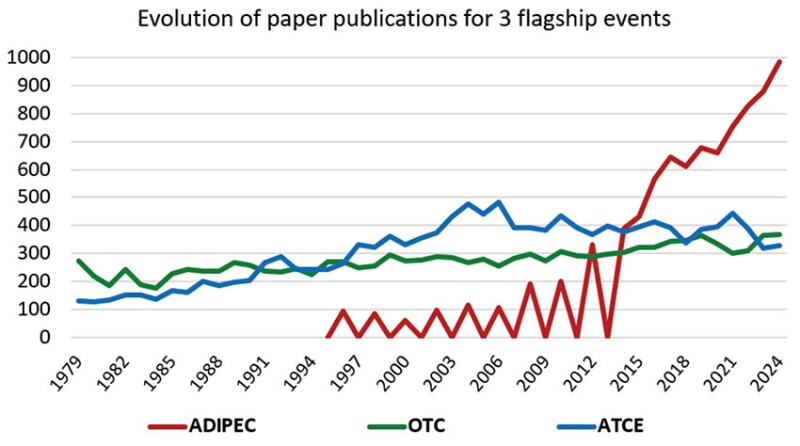
This increase is, however, not uniform. Fig. 9 shows the evolution of the number of papers published at ATCE and OTC, which is consistent with the increase in our membership, and the spectacular evolution of the number of papers published at ADIPEC since it became a yearly event in 2014.
Temporary Conclusion
Beyond perception, statistics confirm a 10-fold increase in the number of SPE papers published yearly since 1980. The ratio is reduced to 4 if we account for the evolution of the size of our membership. One direct interpretation is that only the top 25% of today’s papers have the average quality of what we published 45 years ago. The rest are below. It is my opinion but there is no smoking gun, as there may be other interpretations.
First objection: This increased ratio does not mechanically result in lower publication quality—at least not by a factor of 4. Modern technology has considerably accelerated our ability to accomplish more research and to create and consume more data successively, which could lead to more publishable material. Simultaneously, modern editing tools significantly improve and expand the writing process, increasing our ability to produce more quality material.
Second objection: This inflation in the number of publications is not unique to SPE and our industry. There is a general trend, and we are not an outlier. There is a concern about the quality of research and publications at large. In a way, it is reassuring to see that we are not the only ones with quality problems in our publications, though it is not an excuse for doing nothing about it.
And there are (of course) objections to these objections.
I will stop here and open the debate:
- Do we have quality issues with SPE publications?
- Do too many events lead to too many papers, which leads to too little oversight?
- What impact can poor publication quality have on our legacy knowledge?
- What can and should we do to improve SPE publication quality?
For those who agree that there is a serious problem with SPE publication quality, the question is what should be done about it. This will be the topic of the second column on this topic, but without getting into the details, there are likely to be three main paths:
1. We do nothing (or not much). We accept this inflation of publications as something we cannot avoid, and as we do today, we use the best and ignore the rest.
2. We accept this flood of publications, but we find a systematic way to ‘promote’ higher-quality papers, creating an intermediate population between papers at large and peer-reviewed papers, which would statistically match the quality of 1980s papers, and for example could be good candidates for generative AI projects.
3. We do not give up at all. If we make a top‑down decision to divide the number of papers by 3 or 4, this just will not work. If we wish to reverse the trend in publication quality, this will be a major long-term undertaking that will involve many bottom-up actions at the committees’ level. SPE could provide a canvas or even a quality label.
There are many possibilities, and we will explore these in a future column. You will note that I did not list any potential actions in this column, not because I have none, but because I have probably too many. I’d better do some reality (and acceptability) checks before sharing my ideas with you.
You are welcome to contribute to the SPE Connect President’s page, on this topic and the ones covered in previous columns. I believe your contribution to the debate on quality may be significant.
Visit my SPE Connect channel, “President JPT Column–Discussion Page,” to share your thoughts and insights.


