

To optimize the value of surface and downhole drilling data, an operator, a software company, and a service company have combined forces to develop a system to seamlessly integrate all forms of data, file types, and communication protocols. To ensure that people on the rig and in the office are able and willing to act on the data, the system includes human-factors engineering.
The upstream oil and gas industry first began to gather and stream data from rig sensors in the 1970s and introduced real-time data centers in the early 1980s. Since those early efforts, the industry has made only incremental progress in using available drilling data. These changes typically are limited to improving visual displays, upgrading relational databases for easier reporting, and providing web services for integration.
Today, the widespread use of drilling data remains limited by technology deficiencies in rig sensor measurement quality, sensor accuracy and reliability, rigsite aggregation methods, data sampling rates, and the inability to easily share data between proprietary vendor systems. In addition, drilling electronic data recorder (EDR) technology has not kept pace with the technology of other industries or that of other oil and gas sectors.
Typical service company aggregation systems use outmoded software and hardware. Consequently, these systems are costly to alter, require long cycle times to add features, cannot process the high-frequency data that are collected by modern sensors, and cannot easily accommodate different back-end engines provided by third parties. In addition, because they have closed architecture, changing user interfaces is notoriously difficult.
To address these shortcomings, an operator has built a system that easily accommodates back-end engines, enables rapid prototyping and deployment of new ideas, and separates the back-end from user interfaces. Unlike traditional systems that use only rig data, this new system also uses well information from other data sources.
The design basis was to provide users with higher frequency (up to 100 Hz) and higher-quality data than traditional data-aggregation and -distribution systems. This allows drillers to access real-time models and algorithms for analyses, such as stick/slip mitigation, stuck pipe avoidance, optimal tripping practices, hole cleaning, geosteering, and other drilling methods.
The Fix
Researchers evaluated 30 process controls and other industry applications before selecting a software solution for the data-aggregation and -distribution system that was then prototyped, tested, and deployed on 20 North America land rigs over 18 months. The solution devised by the group, which included a Houston-based operator, a software company, service industry personnel, and research scientists, was built through an incremental, iterative development method that used empirical feedback to enable quick deployment of updated versions.
The group employed an enterprise data historian, typically used for large industrial plant process controls. A historian collects and stores large volumes of time-series data, which facilitates multiple layers of access for faster data archiving, better live data streaming, and reliable handling of communication failures.
The new system was designed to seamlessly integrate all forms of data, file types, and communication protocols. A modular back-end engine that uses technology initially developed at the University of Texas at Austin was integrated for rig state determination, data quality verification, drilling analytics, and smart alarms. In addition, the system is designed to integrate data from rig sensors with the daily drilling-report database, real-time visualization, and an open application layer with a human-machine interface.
To facilitate telecommunications for streaming data to operators’ offices and interoperability between applications, developers divided the system into subsystems and installed automated monitoring and diagnostic tools for administrative support. Each rig application communicates to the office and connects to the enterprise historian. All data interruptions are flagged, investigated, and resolved.
The data acquisition model allows each rig and each well to have a customized data model. The model facilitates the actual data aggregation by collecting and storing in one database all the various data types, file types, and protocols. All data can then be viewed on customizable charts, which allows engineers to easily compare historical data while drilling the well and afterward, while eliminating the need for manual data manipulation.
The new system uses a physics-based Bayesian network model to monitor real-time data quality. The model assigns a quality value to each data point by comparing it to a predicted value that is based on the physics of the subsystem. This process of data cleansing ensures high-quality input data and thus, higher-quality analyses than would be otherwise possible.
The Human Factors
Automated drilling software only adds value when key individuals on and off the rig properly interpret and act on the information provided. Most current drilling-data-aggregation systems were built by engineers at a time when the use of data to increase drilling efficiency and safety was mostly an afterthought. In addition, current systems typically use legacy software that is run on outdated hardware, which makes the systems difficult to improve upon and expand.
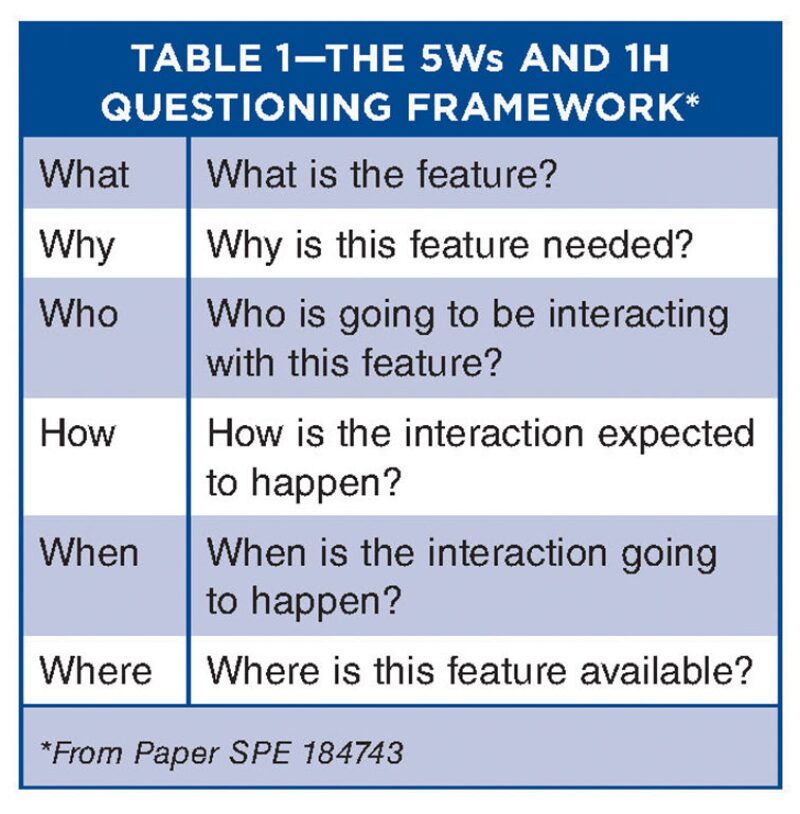
Developers incorporated human factors into the new system through a protocol aimed at answering the “who, what, when, why, where, and how” of disseminating results from its real-time data analysis module (Table 1). Researchers focused on understanding the human-computer boundary and on maximizing the probability that the human will relate to and take action on computer-generated information.
To achieve this goal, system designers followed a process of first building interfaces that appear similar to those typically seen by end users (drillers, company staff, and drilling engineers) and slowly modifying them as user confidence in the system increased. This required a platform that accommodated easy display modification and creation. Alerts required designers to consider data overload, salience, end-user attention, interruptibility, and data visualization.
Displays
In developing the main display for the system, designers looked to reduce the mental workload of the human by creating a display that appeared familiar to the end user. This included retaining vertical strip charts and the ability to customize the tracks, tabs, and buttons. The main display also includes default tracks and tabs that are agreed upon at an organizational level. This was done to allow all users to bring up identical displays and thus create a collaborative work environment.
To further users’ comfort with the display, the placement of transitional buttons mimics the typical layouts familiar to most rig personnel and allows end users to customize certain vertical and horizontal tracks. Users are able to add more vertical strips to the display for temporary viewing and view them by use of a slide bar at the bottom of the display. Based on the users’ preference for visuals that display numbers indicating rig operation status, without having to look at detailed strip charts, the designers added editable boxes.
Rig and office personnel can edit and manipulate each track on the display and include features such as minimum, maximum, and average values within the time frame shown. Drillers can change plot-line thickness and style and, in cases of high-frequency data, filter out noise to smooth the track for better visualization.
To ease data distribution, a feature was added to the display system to allow personnel to email screenshots. Other features include
- The ability to easily reset the view immediately to real time if, for example, a user had scrolled back in time
- The ability to easily toggle between time and depth views
- The addition of a directional-driller rosebud target plot to facilitate the visualization of directional-drilling steering in real time
Reports
To improve drilling performance, the operator wanted to deliver real-time daily reports to field personnel. However, this would have required employees to download and check the data, run database macros, and format the plot for interpretation. But because the volumes of rig data are so large, technical resources at times are constrained for keeping up with the task. Addressing this problem, developers automated the process while continuing to present the data in report forms that are familiar to field personnel.
The first report developed was the “Drilling Parameters Plot,” which consists of a series of vertical charts that replicated most EDR screens. The output includes data plotted by depth and data from an offset well overlaid on the current well drilling to allow drilling personnel to compare parameters and performance between the two wells. Because offset well data are imported into the historian database, the operator can choose parameters from different offset wells for comparison to the drilling well.
The system generates automated daily intelligence reports delivered from the rig to the office or other locations. All the data are stored locally at the rig, and a background process publishes the data to the system receiver in the office at a lower update rate. Some alerts are accompanied by a pdf file that documents the event, which helps receivers determine the nature of the alarm and the proper response.
By creating easily understood real-time displays and reports, a properly designed data-aggregation and -distribution system can add significant value to drilling operations. To overcome the shortcomings of current systems, this new system was designed to be easily adaptable by using a modern technology platform. By placing due emphasis on human-factors engineering, the new system also ensures that humans can easily understand and act upon the large volumes of data at their disposal for optimal impact on drilling performance.
This article contains highlights of paper SPE/IADC 184741, “Taking a Different Approach to Drilling Data Aggregation to Improve Drilling Performance,” by Michael Behounek, Evan Hofer, and Taylor Thetford et al., and paper SPE/IADC 184743, “Human Factors Engineering in the Design and Deployment of a Novel Data Aggregation and Distribution System for Drilling Operations,” by Michael Behounek, Taylor Thetford, and Lisa Yang et al. Both papers were prepared for the 2017 SPE/IADC Drilling Conference and Exhibition, The Hague, The Netherlands, 14–16 March.