

The subject field is in the deep water off West Africa. Over its 7-year life, the field reached a peak production of 90,000 BOPD and produced nearly 100 million bbl of oil from a high-quality stacked Lower Miocene deepwater channel complex. This field provides an opportunity to perform a review of how well the reservoir-performance predictions made at project funding matched with the final actual field performance.
Introduction
The production forecast developed at project funding did a very accurate job of predicting average reservoir behavior such as most likely ultimate recovery and production plateau. However, a more detailed comparison of the preproduction depletion plan and the actual field performance shows significant differences. In particular, both gas and water breakthrough and buildup were faster than expected. These factors were offset by higher well productivity and larger in-place oil volumes. 4D seismic acquired after 3 years of production was particularly effective in illuminating gas and water flow pathways in the reservoir that had not been modeled or predicted. In addition, changes were made to the original depletion plan to increase recovery and in reaction to operational issues. The factors that drove the evolution in the depletion plan are reviewed and an assessment is made on the accuracy of the original production forecast.
Production Forecast Evaluation Criteria
A reappraisal of a production forecast involves three important steps: (1) comparing actual asset performance with predictions at funding, (2) identifying the model assumptions that are materially different from actual performance, and (3) performing a root-cause analysis to understand why these assumptions were made and what could have been done differently. Estimated ultimate recovery (EUR) is often quoted as the key metric, but it is important to look at all of the components of a reservoir evaluation to understand why there were differences.
A typical project oil production profile can be broken down into three components that are critical to project economics. The buildup phase refers to the initial production ramp-up with development drilling and is affected by the initial well rate and number of wells online. The plateau phase refers to the period of steady production after the peak rate is achieved. The plateau rate is typically driven by facilities design capacities. The duration is typically driven by hydraulic limits as wells lose pressure or are affected by encroaching water or gas production. Finally, the decline phase begins when the production drops from plateau and continues to abandonment or contract expiry.
It is important to find the initial estimate and assumptions driving not only the oil production profile but also those of the associated water and gas and injected water and gas. In an offshore development, gas or water handling frequently limits oil production.
It is helpful to have an experienced reservoir engineer and geoscientist facilitate a discussion with former project team members to uncover the root causes of major deviations between funding and actual. Typical questions are
- Has the understanding of the reservoir at the time of funding been validated by post-funding data, or have there been surprises?
- What key data was available at project funding, and were they sufficient to describe the reservoir adequately? If not, what data could have been collected to improve the reservoir description?
- Were there alternative scenarios or data that didn’t fit that were discounted at the time of funding?
- How was uncertainty characterized and communicated at the time of funding?
- How was uncertainty addressed in the appraisal and development drilling plan?
- What has been the reliability of new technologies, work practices, and concepts applied to the project?
In a review of 12 major ExxonMobil projects in which such an approach was applied, several common themes for forecasting pitfalls emerged. These included
- The initial subsurface description is too homogeneous, especially when there are no data to the contrary. This included assuming common contacts across the field, particularly in undrilled fault blocks, and less variability in reservoir quality away from delineation wells. Appraisal wells and early development wells are often drilled in the safest areas that tend to have the highest reservoir quality. The team’s geologic concepts are important for extrapolating properties away from well control. The tendency to be optimistic in extrapolating data has been identified as a key issue in a survey of industry forecasts.
- Predicting reservoir connectivity between different stratigraphic units and across faults is difficult with current techniques. In deepwater channel systems, connectivity can be particularly difficult to predict without dynamic data.
- The range of potential project outcomes should consider different geologic scenarios and the appropriate balance of upside and downside factors. Additionally, capturing uncertainties in areas other than the subsurface characterization (e.g., operational, commercial) can be important.
West Africa Field Case Study
The West Africa field was discovered by an exploration well that penetrated oil-bearing sands and confirmed an original oil/water contact (OOWC) at approximately 2700 m true vertical depth subsea. No appraisal drilling was undertaken. Located offshore in more than 1000 m of water, the field was fast-tracked for development with subsea wells tied back to a floating production, storage, and offloading vessel (FPSO). The database that was available for depletion planning included
- Two moderate quality 3D seismic surveys
- One well penetration (exploration well)
- A 77-m core with routine and special core analysis data
The field’s economic life was estimated to be 6 to 8 years, with recovery at approximately 100 million bbl of oil. Nine wells, drilled from three subsea drill centers, were in the initial depletion plan. Gas export was not available, so produced gas in excess of fuel for the FPSO was to be reinjected at the crest of the reservoir for storage. Water injection was anticipated to be the primary pressure-support mechanism, with the objective of maintaining the reservoir pressure near the original pressure. A strong aquifer was not expected, as is typical in deep-water channelized reservoirs.
To support the full-funding investment decision, reservoir models were built. The geologic model used a 100×100-m areal grid to retain the fidelity of geologic features and contained approximately 5 million cells. The depletion plan was selected after running multiple simulations with a full-field reservoir model to optimize the overall project recovery.
The initial depletion plan consisted of a crestal gasflood and two peripheral line-drive waterfloods.
Fig. 1 shows the actual oil production vs. that projected at funding. Production was initiated in November 2003. Monthly production peaked in 2004 at slightly more than 80 thousand BOPD, and the field started into decline in late 2004. Production was improved at several points then declined steeply until 2009, when it was improved again, and then declined until abandonment in 2011. High-level observations compared early performance against the forecast thusly
- Buildup phase: very similar
- Plateau phase: exceeded forecast by several thousand BOPD; plateau maintained 3 months longer than initially predicted
- Decline phase: Decline starts in late 2004 and is initially slower than expected and then faster, but the last 2 years of field life are similar to what was forecast
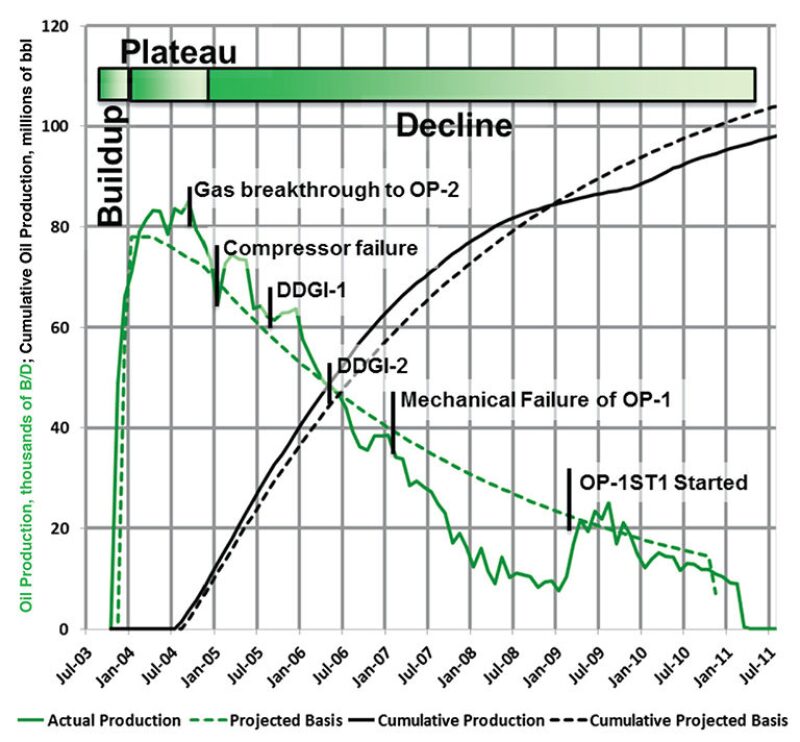
Deviations in oil production can be understood better by examining the other production phases. Gas breakthrough from the crestal gas injection to the producers occurred in mid-2004, as per initial predictions. Field oil production exceeded project funding plan expectations because the well capacity was higher than expected. However, the rate at which field gas/oil ratio (GOR) increased was faster than anticipated, and, by late 2004, the gas production reached the gas-compression capacity limit of 100 million scf/D.
Examination of the water cut (WC) is also informative. Water breakthrough at the farthest downdip producer was observed in the fourth quarter of 2004, just a few months earlier than the funding model. In the funding model, however, the early water production caused the field to come off of plateau because of the well hydraulics. Actual production, however, remained high even with higher water production. A decision was made to defer the drilling of a fourth water injector on the northern flank of the field because that area was receiving better pressure support than expected. In early 2005, water broke through to a second producer and water production increased much more rapidly. By mid-2006, WC was 40% compared with 30% expectation. At this point, oil production began to decline steeply because of productivity loss from barium sulfate scale formation.
The West Africa field ceased production in early 2011, 7 years after startup. The total production was 99 million bbl of oil, very close to the 104 million bbl of oil EUR estimate at funding. Although the total recovery was close to expectations, the production history was different. Most areas of the production forecast initially met or exceeded expectations, but there were areas that underperformed expectations. Early well capacity was higher than expected, followed by poorer performance because of rapid GOR growth, wellbore scaling, and a well failure. In late life, uplift resulted from good performance of a replacement oil producer. Mitigation plans were executed along the way to increase production and maintain recovery. The depletion strategy was adjusted to take full advantage of the improved displacement efficiency of gasflooding and the improved sweep efficiency of waterflooding through different combinations of crestal water injection and downdip gas injection. Scale squeezes arrested the scale damage and drilling of a replacement well captured remaining oil.
The original depletion plan recognized a risk associated with scale formation within the production wells’ tubing. The barium and strontium content of the formation water in this field is high, which can cause scaling problems in wells after injected seawater breakthrough. Scale-inhibitor treatments were forecast for each well assuming yearly squeeze treatments beginning after 1 million bbl of water production per the simulation. The original plan called for nine scale squeezes; however, 20 scale squeezes were performed through February 2010. The ramp-up in scale-squeeze treatments was because of the increased breakthrough of seawater in the different producers, caused partly by the change in injection strategy and partly by the improved reservoir communication. This illustrates how the characterization and modeling of reservoir connectivity indirectly affected an operational matter such as the frequency of scale treatments.
The static and dynamic characterization factors that had the greatest effect on performance differences from funding were reservoir connectivity, scale formation, and aquifer influence.
This article, written by Special Publications Editor Adam Wilson, contains highlights of paper SPE 166317, “Assessing the Accuracy of a Production Forecast: West Africa Field Case History,” by Anna Apanel, SPE, Robert Tester, SPE, and Brodie Thomson, ExxonMobil Production Company; and Ginga Mateus, SPE, and Gaspar Marques, SPE, Esso Exploration Angola, prepared for the 2013 SPE Annual Technical Conference and Exhibition, New Orleans, 30 September–2 October. The paper has not been peer reviewed.