Rice University’s Baker Institute for Public Policy issued an update to its interactive China Energy Map launched last year. The goal of the map project is to provide an open, comprehensive, and regularly updated source of energy infrastructure data to help facilitate improved analysis by a broad range of participants.
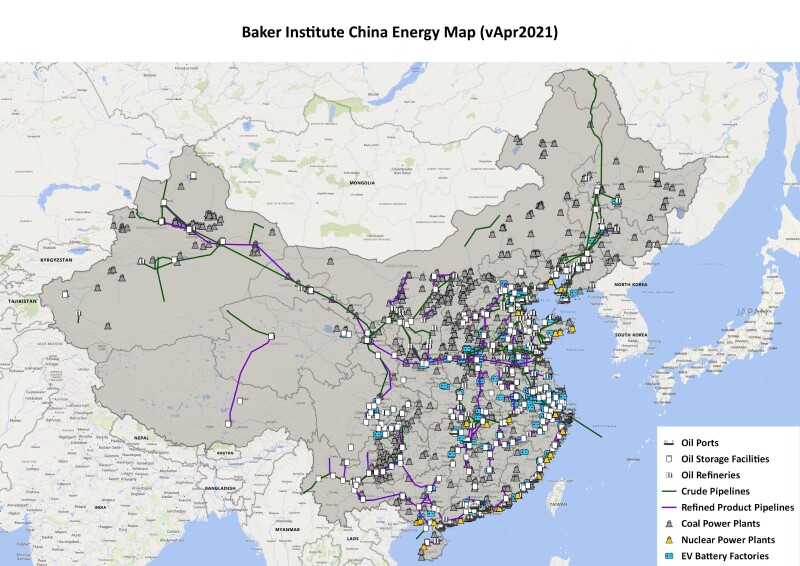
The map provides an online visualization of key energy infrastructure. Since the first release of the Baker Institute China Oil Map in February 2019, the map has evolved significantly and continues to grow. In addition to the existing oil infrastructure layers, including crude oil pipelines, refined product pipelines, oil refineries, crude oil, and products storage facilities, and oil ports, the map also tracks coal power plants, nuclear power plants, and EV battery factories to give a more accurate picture of China's complete energy system.
By clicking an icon or line on the map, facility-level information is displayed in the popup tooltip, including facility name, operator, status, year online, designed capacity, and additional infrastructure details. As of April 2021, the China Energy Map had the following total coverage by infrastructure type:
- Crude oil pipelines: 98 pipelines with a total length of 25,430 km and total throughput capacity of 23 million B/D
- Refined product pipelines: 89 pipelines with a total network length of 28,686 km and a total throughput capacity of 7.9 million B/D
- Oil refineries: 210 facilities with 22.7 million B/D of processing capacity
- Oil storage facilities: 292 facilities with approximately 1.15 billion bbl of total storage capacity (crude oil: 76 facilities with 790.6 million bbl of capacity; refined products: 216 facilities with 360.2 million bbl of capacity)
- Oil ports: 61 docking facilities for oil tankers with a total throughput capacity of 15.3 million B/D
Future updates to the map are expected to focus on identified weaknesses of the existing product. Baker said it currently provides solid coverage of asset stock and designed capacity, but not the physical flows through that stock. Accordingly, the map would benefit greatly from including real-time data that could be updated on a regular basis, such as pipeline flow, refinery runs, inventory changes, tanker offloading, and real-time electricity output by plant.