
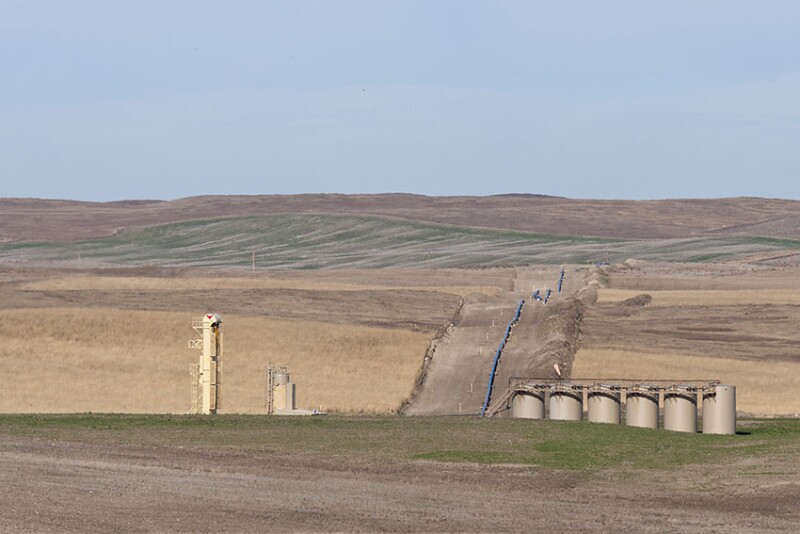
Since approximately 2012, large multistage completions in horizontal wells have significantly boosted oil production in the Bakken Formation. As of the time of writing, more than 18,000 stimulated wells have been completed in Bakken using various completion designs.
Operators have experimented with well spacing, as well as the size and intensity of stimulation jobs by injecting increasingly large volumes of fluid and proppant to maximize oil production while minimizing costs. However, wells that received larger treatments did not always perform as expected. Furthermore, the aggregated impact of various interrelated completion design parameters and reservoir characteristics was not fully understood, leaving room for improvement in completion optimization evaluations.
Publicly accessible completion and production data, meticulously collected by the North Dakota Industrial Commission (NDIC), combined with advancements in data science, have created an excellent opportunity to optimize drilling and completion strategies using statistical data analysis and predictive modeling. Observations and experiences from thousands of producing Bakken wells can now be analyzed and interpreted using data mining techniques.
This article presents examples of data science applications in completion optimization calculations in Bakken production.
Completion Design Optimization Using Predictive Modeling
The initial optimization study analyzed drilling and completion results from more than 12,000 oil-producing wells across the Bakken in North Dakota using 2020 data (URTeC 3723843).
Simple interpretations of the relationship between production performance and completion parameters, based on bivariate (two-dimensional) scatterplots, proved challenging due to the nonlinear nature of these dependencies.
Data-mining techniques capable of accommodating nonlinear relationships and complex, incomplete information were applied to identify optimal completion practices. The dataset used in this analysis included eight publicly available completion design parameters:
- Perforated interval
- Injected fluid volume
- Proppant amount
- Stage count
- Injection rate
- Injection pressure
- Proppant type
- Completion type
These parameters were used to predict well performance, measured by cumulative 6-month oil production. Predictive modeling was performed using the gradient boosting (GB) data-mining tool, in which multiple decision trees described the variability of the multidimensional dataset. The initial predictive modeling conducted for the entire Bakken play demonstrated acceptable performance for the training model (evaluated by R²), but the test model—using 20% of all data—showed weaker performance.
This phenomenon, known as overfitting, occurred when a single statistical model struggled to accurately predict well production performance across various Bakken locations which are characterized by heterogeneous geology and reservoir properties.
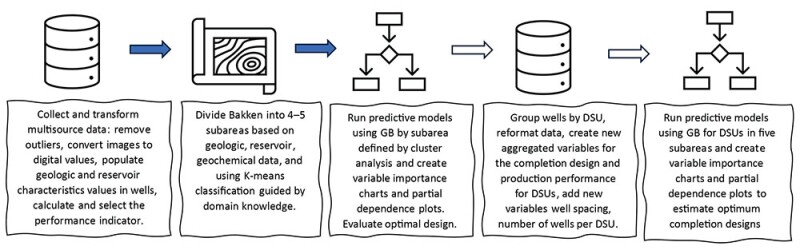
To mitigate the impact of geologic variability and improve test statistical models, the analysis was conducted separately on three groups of wells located in distinct Bakken subareas representing low-, moderate-, and high-productivity regions, with approximately 300 wells in each group (URTeC 3723843). The predictive models developed for each three groups of wells generated:
- Variable importance graphs, ranking the significance of each completion design parameter
- One-variable dependence graphs, used to estimate the optimal values of completion parameters that maximized 6-month production while minimizing stimulation job size (e.g., fluid volume or proppant mass)
Unsurprisingly, across all three investigated subareas, total proppant and total fluid emerged as the most influential factors affecting well performance. This finding aligns with common completion practices and previous studies demonstrating a strong correlation between these parameters and oil production.
However, the results also suggested different optimal completion configurations for each subarea. The high-productivity subarea located in the core area of Bakken benefited from higher total proppant and higher treatment pressure, while the moderate- and low-productivity subareas achieved maximum oil production with slightly lower proppant amounts, increased fluid volumes, and lower treatment pressures. These differences in completion strategies were attributed to variations in formation depth, temperature, pressure, maturity level, reservoir thickness, and other geologic characteristics.
Completion optimization evaluations were done using a series of partial dependence plots which showed how the increase of the completion design parameter impacts the well performance (6-month production) while holding all other predictors (completion parameters) constant at average values.
For instance, Fig. 1 shows that maximum production performance in the core area of the Bakken is achieved when 10 million lb of proppant are injected.
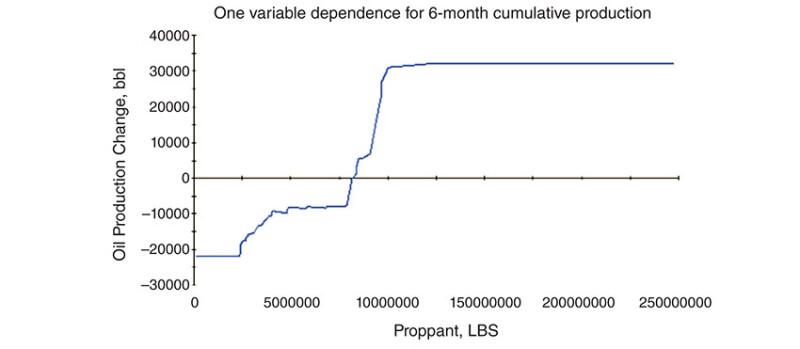
Further increases of the proppant amount beyond this threshold does not improve oil production. Similar plots were built for the injected fluid, number of stages, injection rate, proppant type and other completion parameters. It is important to note that the optimal proppant amount in Fig. 1 was determined using the 2020 dataset representing a section of the core area. The results of optimization evaluations are subject to change if newer or larger datasets are used or if the analysis focuses on different Bakken locations.
Cluster Analysis Creates Subareas of Bakken
Given that both geology and completion design control well performance in unconventional oil and gas plays, the completion optimization methodology was further developed by providing a quantitative means for integrating geologic factors into completion optimization analysis (Chakhmakhchev et al., 2021).
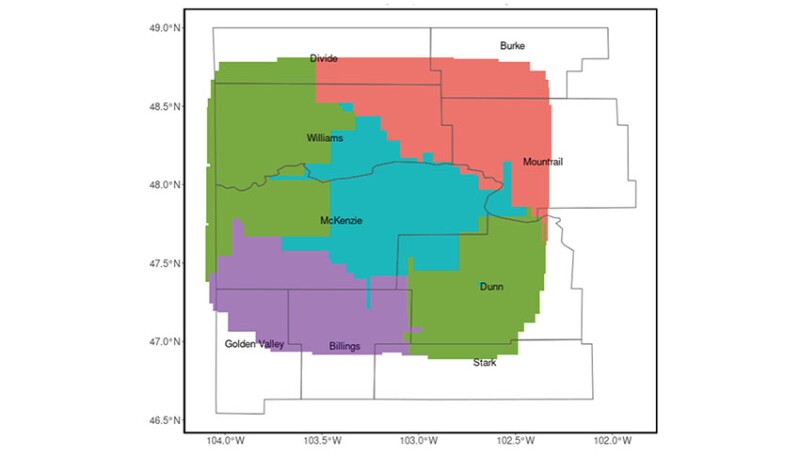
Cluster analysis based on more than 14,700 wells was completed using publicly available cartographic and tabular data (Sonnenberg 2017, NDIC, and North Dakota Geological Survey). The input geologic data included formation depth, thicknesses, temperature, pressure gradient, porosity, and permeability. Additional geochemical information integrated into this analysis included source rock characteristics such as hydrogen index (HI), Tmax, total organic carbon (TOC), and bulk oil and gas properties.
K-means clustering algorithm was used to group wells and create subareas characterized by similar geologic and reservoir characteristics. The resulting five subareas had well-defined boundaries with minimal overlap (Fig. 2). The values of key geologic and geochemical variables driving classification aligned with domain expertise in the Bakken.
This stratified approach of analyses can be extended beyond individual well evaluation to optimize drilling spacing units (DSUs) (Fig. 3). The DSU optimization analysis aggregates well completion and production values while incorporating additional predictors such as well spacing and well count per DSU to account for wells’ interaction.
Lesson Learned
The completion optimization evaluations were based on the analysis of actual completion design strategies implemented in thousands of stimulated wells. The statistical approach used in these evaluations did not model physical processes but instead learned from historical operational data.
Since the beginning of Bakken development in 2005, completion technologies have continually evolved. This evolution has included increased stimulation intensity, longer laterals, the application of diverters, and recompletions. To ensure meaningful optimization calculations, the input dataset must consist of wells completed using similar technologies. One way to achieve this is by filtering data based on year of completion, with 2012 and 2017 serving as major technological milestones.
Future enhancements of the partial dependence plots could include the use of heat maps or 3D charts to visualize the combined effects of multiple completion parameters on production performance. Furthermore, rather than assuming static values for other parameters in partial dependence plots, sensitivity analysis on a simulated dataset is recommended. This approach would set predictors at their respective quantiles (e.g., 20, 50, 70, and 90%) and generate partial dependence plots reflecting multiple scenarios.
The 6-, 12-, and 24-month cumulative oil production metrics have proven to be reliable indicators of well performance.
However, a more refined assessment can be achieved by calculating the best 6-, 12-, and 24-month cumulative production volumes using a sliding window approach. Relying solely on the first 6- or 12-month cumulative volumes may not always yield an accurate assessment of well performance, as initial production rates are often influenced by operational constraints. Operators frequently curtail early production due to both technical and nontechnical reasons, such as facility limitations, market conditions, or pressure management strategies. By incorporating the sliding window technique, the impact of such constraints can be mitigated, leading to a more precise evaluation of well productivity.
The k-means algorithm remains an effective tool for assigning wells to geologically similar clusters. Although k-means is an unsupervised learning method, the number of clusters must be specified in advance.
Formal approaches such as the elbow or silhouette methods can assist in determining the optimal number of clusters, but domain knowledge should ultimately guide the selection to ensure alignment with regional and local geologic trends.
For Further Reading
URTeC 3723843 Completion Optimization in the Bakken Petroleum System Using Data Mining by A. Chakhmakhchev, N. Azzolin, B. Kurz, X. Yu, C. Dalkhaa, J. Kovacevich, and J. Sorensen.
Using Cluster Analysis To Enhance Completion Optimization Studies of the Bakken Petroleum System by A. Chakhmakhchev, N. Azzolina, B. Kurz, X. Yu, J. Kovacevich, K. Glazewski, J. Sorensen, C. Gorecki, J. Harju, and E. Steadman. EERC, Bakken Production Optimization Program report in public domain (2021).
The Giant Continuous Oil Accumulation in the Bakken Petroleum System, US Williston Basin by S.A. Sonnenberg, C. Theloy, and H. Jin. AAPG Memoir, Giant Fields of the Decade 2000–2010. R.K. Merrill and C.A. Sternbach (eds), American Association of Petroleum Geologists (2017).

Alexander Chakhmakhchev, PhD, SPE, independent consultant, holds more than 20 years of experience in the international petroleum industry. He previously served as a principal scientist at the Energy & Environmental Research Center (EERC) at the University of North Dakota from 2019 to 2025. He led research under the Bakken Production Optimization Program, focusing on enhanced oil recovery, production optimization, geochemical solutions, and environmental protection. He also previously worked as a senior data scientist at Applied Chem Data and as principal geochemist at SGS Oil, Gas, and Chemical Services in The Woodlands, Texas. He can be reached at alchak@sbcglobal.net.