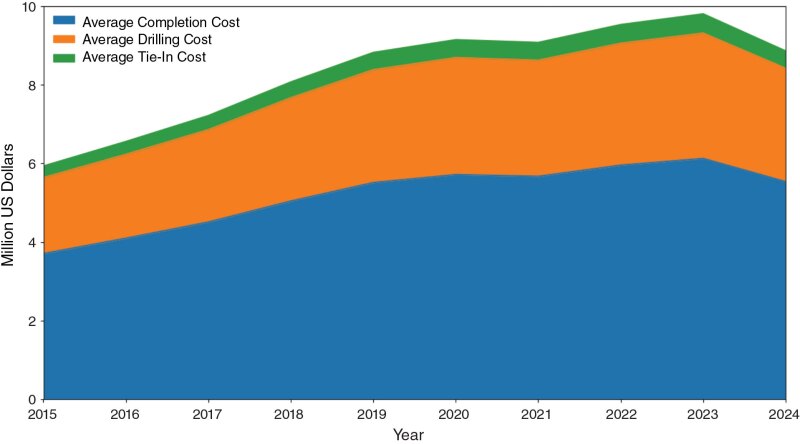
The primary objective of the study described in the complete paper is to assess thoroughly the influence of various completions, fracturing stimulation, and intrinsic reservoir properties on the productivity of 10 major unconventional oil and gas plays while uncovering key insights and emerging trends unique to each play. This data-driven study offers important insights into factors affecting productivity in shale plays, aiding future well development and resource-extraction optimization, and provides technical guidance for unconventional oil and gas developments in North America while serving as a useful reference for similar projects globally.
Methodology
This study used publicly available data from Enverus specifically focusing on well-production data from January 2015 to June 2024. The data set covered 10 distinct unconventional plays across North America (Bakken, Barnett, Delaware, Duvernay, Eagle Ford, Haynesville, Marcellus, Midland, Scoop/Stack, and Utica). Among these are six oil plays (Bakken, Delaware, Duvernay, Eagle Ford, Midland, and Scoop/Stack) and four gas plays (Barnett, Haynesville, Marcellus, and Utica). A total of 91,519 horizontal wells were examined in this study. To maintain accuracy, the study excluded wells that began production before 2015.
The analysis focused on four main aspects: well fracturing, downhole consumables, production, and geological properties. Specific data extracted from each well included the number of wells per pad, well density, horizontal and vertical spacing, stimulated lateral length, number of fracturing stages, clusters, perforations, proppant and fluid usage, chemical composition, fracturing-job types, pumping rates, and cumulative production in barrels of oil equivalent during the first 3 months.


