

The maturing application of horizontal drilling and hydraulic fracturing in the US, and the resulting spike in crude oil production, increased US gross domestic product (GDP) by roughly 1% during 2010–2015, according to a study published by the Federal Reserve Bank of Dallas.
That amounted to 10% of total US GDP growth from a sector that makes up less than 1.5% of the economy. The impact on the overall economy came as US crude production jumped to 9.4 million B/D from 5.5 million B/D during the same period, US Energy Information Administration (EIA) data indicate.
As the shale boom flooded the market with light crude, oil and oil-product prices declined, refiners took in as much domestically produced light oil as they could, and oil imports declined nearly 2 million B/D. Fuel prices in the US and abroad fell 14% as consumers benefited from free trade in refined products, according to a model generated by the Dallas Fed researchers who authored the study.
Cheaper fuel prices resulted in a 3.6% rise in fuel consumption and 0.7% increase in overall consumption. Not only did households benefit from having more disposable income due to lower fuel prices, but industries were able to boost their output of non-oil-related goods and US aggregate investment rose.
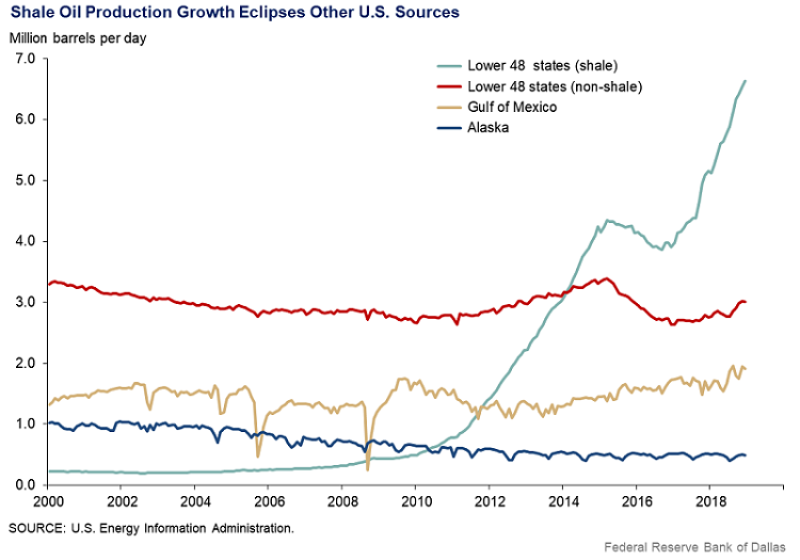
Much of the positive economic impact was driven by Texas and North Dakota and their respective shale oil growth engines: the Permian Basin and Bakken Shale. During 2010–2015, overall oil output in Texas increased to 3.4 million B/D from under 1.2 million B/D, while North Dakota grew to almost 1.2 million from 308,000 B/D, EIA data show.
Those two states experienced strong employment and GDP growth in particular during 2010–2014 when oil prices averaged $95/bbl: North Dakota’s GDP expansion was 4.5 times that of the US, while Texas’s was 1.5 times the national rate. North Dakota’s employment growth averaged 5.3% and Texas’s averaged 3%, compared with 1.7% for the US as a whole.
While those numbers have fluctuated since the oil-price downturn that began in mid-2014, the trade effects are lasting. In 2006, before the shale boom, the US imported about twice the amount of oil it produced. Now it imports the equivalent of two-thirds its production, with the US petroleum trade balance narrowing to negative $136 billion in 2018 from negative $492 billion in 2005.
US exports of petroleum products have jumped fivefold since 2006 to 5 million B/D. And, since the crude export ban was lifted, the US has become a major exporter, with exports rising to 3 million B/D last month from less than 500,000 B/D in December 2015.
Authors of the study outlined their methodology and process in their paper (PDF) published on the Dallas Fed website. Their analysis employed a two-country, multiperiod equilibrium model describing the decisions and interactions of households, oil producers, refiners, and the non-oil-production sector. It assessed the boom’s implications by comparing its effect on a model economy with what happens in the economy absent the boom.