Noble Energy has had powerful motivation to invest in learning how to maximize the return on its wells in the Wattenberg field in Colorado—its biggest current investment and key to the company’s aggressive growth program.
Over the past 3 years, the independent oil company has drilled nearly 600 wells in extremely tight Niobrara formation rock. The company plans to go from 320 wells per year in 2014 to 680 wells in 2018, according to a recent Noble Energy investor presentation. This effort is needed as it works to double its daily production over the next 5 years.
For the team working to maximize production and profits in that field, one of the biggest questions has been, and continues to be, how many wells to drill per square mile.
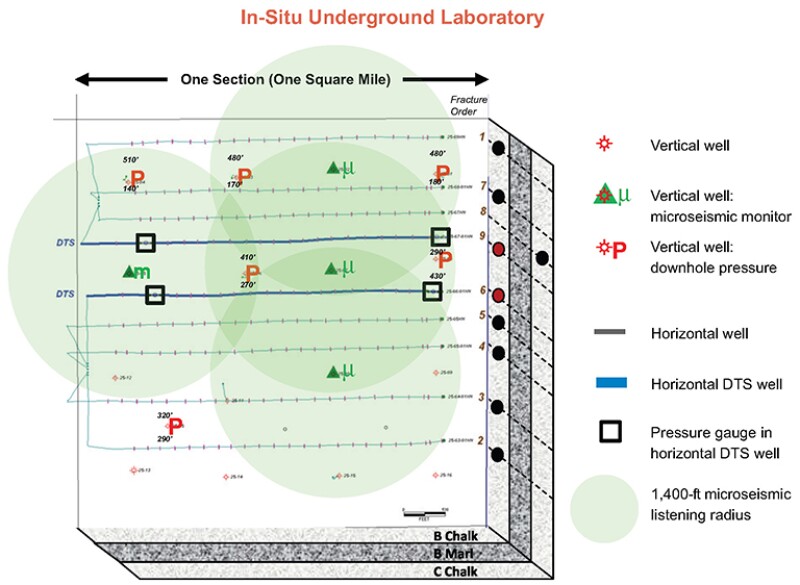
This is a common question in the industry, but the company has done something uncommon to help answer it: Noble created an “Underground Laboratory.” It is in a section of land with nine horizontal wells, spaced at varying intervals. The “Laboratory” includes a pair of horizontal wells with multiple fiber-optic and pressure sensors amid a cluster of vertical monitoring wells and provides a multidisciplinary team of geoscientists and engineers a rare and unusually detailed look at oil production in the Niobrara on a meter-by-meter basis.
“What we are trying to do is essentially bring the equivalent of high-definition television down underground to directly observe what is happening and then come back and figure out, how do we explain what we see,” said Dave Koskella, exploration and reservoir systems manager at Noble.What looks like a geoscientist’s fantasy come true—a list of diagnostic tools included in a presentation at February’s SPE Hydraulic Fracturing Technology Conference in The Woodlands, Texas, consisting of 13 items, some with subheads—was created to answer critical questions facing the business. “It is a laboratory that is challenging our insights and beliefs about why and how things are working in our wells,” he said.
While Noble’s investment in diagnostics is exceptional, the problems it is trying to solve are common for the companies focusing their exploration and production program on developing unconventional formations in the United States and Canada.
While the cost of doing all that is high, that expense is a small percentage of the billions spent on large-scale field development.
“People do not want to drill their way to optimization,” said Paul Huckabee, a completions engineering adviser at Shell, at the fracturing conference. “These help our understanding of the complexity of the system.”
Devon Energy assembled a large team of engineers and geoscientists that used multiple data-gathering methods to generate the information needed to feed multiple modeling programs to plan the development of an extension of the Barnett shale, where past drilling had been hit or miss.
The effort led to a system for drilling and completing wells that nearly doubled the expected ultimate output of the wells, and led the company to reconsider how it manages its wells nearby in the Barnett core.
“What we found when we were working on that project is we can learn something later in the life of a play that not only will affect new wells,” said Jeff Dahl, a completions engineer at Devon. “We can take that knowledge into refracturing older wells.”
Forty Versus Eighty
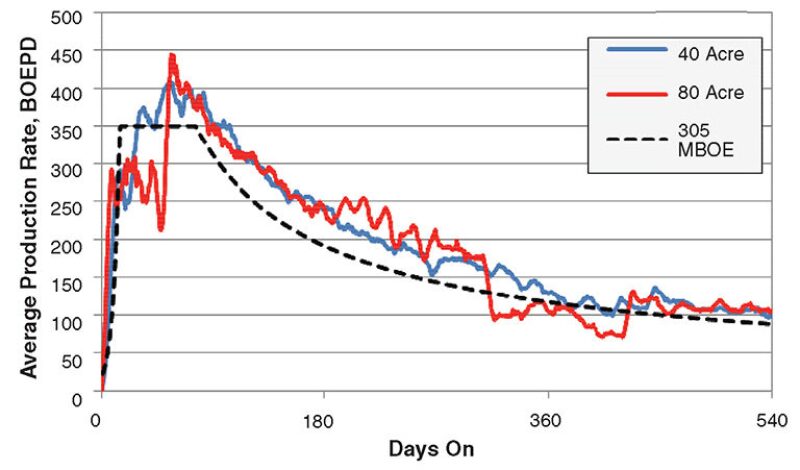
When it comes to well spacing, Noble’s testing concluded that based on 2 years of production data it could move to 40-acre spacing, because each well is expected to produce as much as a well draining 80 acres, Koskella said. Now the Noble team is looking to see if tighter spacing is possible. He said it may go as low as 20 acres per well in the 300-ft-thick rock, which is thicker than other well-known unconventional liquids-rich plays.
The decision could have a significant impact on the value of more than 600,000 lease acres. A Noble investor presentation estimates the net present value of 40-acre spacing at USD 70 million/sq mile and 20-acre spacing might push that to USD 130 million.
But those values assume the added wells are not draining overlapping areas. The reservoir systems team at Noble, and every other company in these fields, has to figure out at what point added spending on drilling and completing more tightly spaced wells reduces the value of the wells, because they are draining overlapping areas, which speeds production rather than adding more ultimate production by reaching more of the reservoir.
“Noble’s data-gathering program is seeking a measure of when added field development spending reaches the point of decreasing returns,” Koskella said. “This is not a perpetual motion machine.”
Based on 2 years of observations in the Wattenberg, Noble concluded that the area covered by a well’s productive fracture network is smaller than would be commonly estimated, fracture fluid frequently leaks from one stage to the next, and fractures near natural fracture networks are not necessarily as productive as is often assumed.
The study done by Devon, however, sought out natural fracture networks for hydraulic injection points, because it saw them as a way to achieve its goal of creating more complex fracture networks.
Given the many differences among shale formations, both companies could be right, which is good news for those developing the tools for advanced field analysis. “It is a rapidly emerging technology. There is a clear benefit in diagnostics,” said Dan Hill, head of the petroleum engineering department at Texas A&M University.
Shell has been using advanced diagnostic methods to study the tight-gas wells in its Pinedale field in Wyoming. It has found, “we are not stimulating all the sands we intended” to fracture, said Gustavo Ugueto, a senior petrophysical engineer at Shell. His presentation at the fracturing conference described Shell’s Pinedale monitoring program, which dates back to 2005.
Observations using multiple methods, including fiber optics to measure temperature change and sound, showed the fractures created in vertical wells often diverged from the plan. The height of the fractures was often less than planned—in one well, 53% were less than intended—and many sands were not treated—only 64% were stimulated by the hydraulic fracturing in one well, according to the Shell paper.
The observations from five wells gave the company insight into how to make adjustments to improve its results in the many wells drilled in Pinedale, such as changing how it perforates wells to target smaller intervals in broad zones it had been missing.
Sometimes the problem is not the fracturing technique; the formation can be is to blame for a lack of production. Ugueto said that “stimulation of 100% of the available pay may be impossible, or uneconomic.”
“With diagnostics, you can make modeling more certain,” Ugueto said. “Doing without this (monitoring) is like reservoir modeling without production history matching.”

This table summarizes observations from 38 stages completed in two wells. Fiber-optic monitoring allowed Noble Energy to track the flow of the fracturing fluid, which is cooler than the reservoir temperature. Fiber-optic temperature sensors were used to identify dominant and significant fractures, where multiple ones have been formed. These are based on the time needed to warm the cooler fracturing fluid to the reservoir temperature. Larger fractures are associated with those fractures that are slowest to warm. The table also summarizes where fractures developed within a stage, with more near the packer isolating the zone on the side near the start of the lateral, the heel, rather than the toe. There were 17 stages with a packer leak toward the toe, and four stages had a leak on the heel side. Both packers leaked on at least one stage. |
Emerging Needs
Demand for oilfield diagnostic testing, like medical testing, is driven by worrisome symptoms. “We are getting the production history out 3 to 5 years in some areas. It is well past that in the Barnett. In the Bakken and Eagle Ford, we are beginning to see the declines are falling off much faster than originally projected,” said Robert Barree, president of Barree and Associates. “We are at a turning point as people are beginning to understand how to evaluate these plays.”
The process is raising some tough questions. “I think the models we have developed for reservoirs to do production matching and analytics work pretty well for conventional reservoirs, but for unconventional, tight ones, these models are way too simplistic,” Koskella said. “I do not believe they are mimicking reality.”
Noble uses standard methods for evaluating the well using surface production information, but interpretation of what is really happening underground based on variable mixtures of oil, gas, and water is extremely complicated, Koskella said.
“In addition to the standard methods of well interpretation and performance analyses predicting what is occurring underground, we are starting with the direct underground observations and then building the technical explanations,” he said.
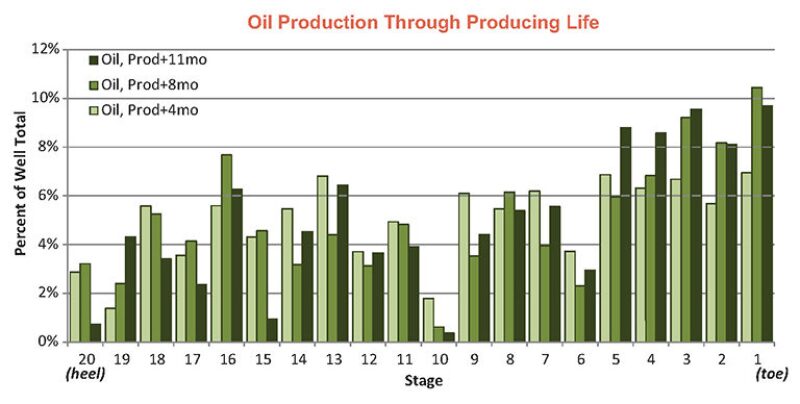
Using a system to measure what is going on throughout the well, Noble is able to observe how each fracture stage performs, and how it changes over time.
Fiber-optic digital temperature sensors can track where the water from fracturing goes, because it is considerably cooler than the formation. During fracturing, that can be used to observe when water leaks from one stage to the next. The sensors can track the gradual process of the formation warming up after fracturing. The pace varies based on the amount of water injected into the formation at any particular spot.
Over time, those sensors allow detailed production logging that shows what each stage is contributing and fluctuations over time. Another fiber-optic cable allows Noble to listen to what is happening there. This acoustic monitoring offers further evidence of what is happening along the wellbore during fracturing and afterward. Interpretation methods for this emerging technology are still in their early stages.
Chemical tracers injected during fracturing, each with a unique signature, can offer information about the productive fracture network beyond the area that is propped open. Multiwell microseismic testing using multiple arrays helps show the extent of fracturing. Downhole pressure gauges provide an additional stream of data for analysis of pressure trends over time.
Microimaging logs can observe the larger fractures along the wellbore, but Koskella said it is known that microfractures too small for the instrument to detect may be more productive than the ones it is able to observe.
Proppant with radioactive tracers can be used to measure how much proppant enters the formation, and Noble used it to see how far it would travel. None of the marked proppant moved horizontally through the formation to observation wells 165 ft away, though it did travel upward and downward through the formation. These observations were consistent with the horizontal and vertical stress patterns in the formation, Koskella said.
Noble tested the widely held assumption that fracturing into areas with dense natural fracture networks will mean better production. “When you see an area with a lot of natural fractures in the well, many people say that is where it will produce best,” Koskella said. “When we overlaid the well production, compared to where the natural fractures are observed, we found that they do not overlay each other. It was quite a surprise to us.”
Barree, a petroleum engineering consultant whose work in fracturing dates back to the 1980s, said he sees examples of developments with closely spaced fracturing stages that are already draining overlapping areas within weeks after the start of production, and wells that are draining the same area within a year or so. “At that point, they are overspending on well density for short-term production gains. The recoveries are the same in the end, but they are spending to produce it all in 2 or 3 years,” Barree said. Maximizing initial returns “is not necessarily a good economic decision.” The ideas were presented at February’s SPE Hydraulic Fracturing Technology Conference where he said the problem of overdevelopment is “probably the biggest challenge we have in the industry.” When Barree talks about a longer-term approach, he means the economically useful production period for a well is up to 5 years. He said that is on the longer end of estimates of the prime producing period for these rapidly declining wells. “If you put any kind of realistic required rate of return and discount value, anything past 5 years has negligible present value,” he said. “Some say 3 years is more realistic. I put 5 years as a reasonable to optimistic number.” “Fracturing should be based on contact reservoir volume,” said Barree. “The ultimate recovery will only be increased if you can increase the drainage (area) volume.” The notion that wells drain a fixed area is not a point of contention. The contentious part is measuring that area, and how much the fractures in that zone can transport over time. There is no way to directly observe the flows of oil and gas through the reservoir rock into the wellbore. For that reason, Barree’s 30-page paper offered a method using estimates of system permeability using injection falloff tests, which measure permeability based on its response to pressurization. He said that approach offers a far better measure of these heterogeneous systems than testing cores in a lab to determine permeability. “The hardest thing for most people to accept is that fractures are just not as efficient as we would like to believe,” he said in his paper. “Actual effective producing lengths are short; therefore, stimulation design should focus on connecting as much of the drilled well to productive reservoir as possible.” |
New Models
A limit common for many of the in-well tests is they offer useful observations, but not precise measurements. “You can gain a lot of insights. It is not empirical, it is more of direct indication,” said Christine Ehlig-Economides, a petroleum engineering professor at Texas A&M University.
That is a big limit in an industry driven by data-powered modeling, so there is a lot of work directed toward extracting as much meaning as possible from each test. That leads to arguments over how much to make of these measures. A good example is the measure of the stimulated reservoir volume, which is supposed to define the area fractured. The volume measure is based on microseismic imaging of sound recorded from deep in the ground during hydraulic fracturing.
Images based on these seismic popping sounds are used as evidence for everything from an indication of which fracturing stages have been effective, to a measure of what volume of rock is likely to be productive.

“Users need to be more aware of the limits of what conclusions can be drawn strictly from a fractured volume based on microseismic,” said Craig Cipolla, a senior engineering adviser at Hess, during a presentation titled “Stimulated Reservoir Volume: A Misapplied Concept?”
“Simply looking at it as an area that is drained oversimplifies the system,” said Cipolla. “Complex hydraulic fracturing models need to be integrated into reservoir simulations.”
The sounds picked up by seismic receivers are not necessarily the result of the creation of a productive fracture. When fractures are created, they may quickly close up for lack of proppant to hold them open, or they may not provide productive connections to the well after the fracturing is done.
The sound source may be a rock that must physically accommodate the change caused by the hydraulic force being applied elsewhere, Koskella said.
The reality is when the number of pops recorded is compared with the likely impact of the energy added to a formation, it appears that most of the fractures are not likely observed, said Cipolla, who has long experience in such analysis.
Test Well DetailsTwo horizontal wells in Noble Energy’s Wattenberg field development were equipped with fiber-optic cables and pressure gauges for intensive monitoring. Well Dimensions: Depth: 6,700 ft Lateral: 4,000 ft Stages: 20 Spacing: 200 ft Type: Open hole using packers for isolation and sliding sleeves Monitoring locations: Fiber-optic cables outside the casing; pressure gauges at the heel and toe of the lateral Proppant: 200,000 lbm per stage Water: 140,000 gal per stage Oil in place: 70 million BOE per sq mile Oil weight: 40°API |
The physical area likely represented by the observed sound represents a tiny fraction of the area fractured, but appears larger in displays for the same reason that tiny towns look bigger on maps to make them easier to read. “We should never throw out microseismic,” Cipolla said. “It is valuable information because it does provide direct evidence of what happens to rock during fracturing, but its limits need to be recognized.”
Makers of fiber-optic systems are working on ways to use their ability to measure temperature and pressure to quantify fluid flow like a production logging tool, said Eric Holley, product champion for fiber optics at Pinnacle, Halliburton’s microseismic and fiber-optics services arm. Permanently installed fiber can regularly measure flow, “so you can get a transient look at the production distribution,” he said.
Acoustic fiber has been used to detect leaks, such as fluids moving past a packer, but acoustic data analysis is in its infancy. At Texas A&M University, there is a project aimed at measuring the volume of fracturing fluid flowing through a perforation by measuring the intensity of the sound. Work so far has shown there is a correlation between the sound level and the flow rate in a laboratory, but much work is needed to turn that insight into something that works in a well.

Downhole Laboratory Test MethodsIn a select group of wells in the Wattenberg field, Noble Energy used in-well testing in what it called its Underground Laboratory. These included: Downhole microseismics—6 wells Downhole pressure gauges—10 in 8 wells Fiber-optic—2 wells Radioactive proppant tracers–3 wells traced, 5 logged Chemical tracers—9 wells Fullbore microimaging—9 wells Core analysis—2 wells Diagnostic fracture injection tests—9 wells Vertical seismic profiling Geochemistry testing—core and oil 3D seismic |
Noble has shown it is possible using fiber-optic temperature sensors to observe fluid entry points and measure fluid flows at multiple points along the wellbore, which Koskella said was an industry first. One of the primary goals of the Noble program has been to learn what methods can be used to answer specific questions. It is adding another pair of fiber-optic wells and data gathering in other wells as needed.
It is also working on how to best extract useful insights from the staggering mass of data—80 terabytes and rising—generated by just two of its full instrumented wells.
Fiber-optic cables are prolific data generators. Multiple strands of fiber send constant readings of what is happening along thousands of points in a well 24 hours a day for years.

During fracturing, the combination of fiber-optic monitors allowed Noble to know in real time that while it was fracturing stage 2, the sliding sleeve in stage 20 opened, reducing pressure down the lateral. Noble then knew to stop the job and fix the balky hardware to ensure all the stages were properly fractured.
For makers of fiber-optic systems, a major challenge is creating software that sifts through this big data for those small bits that offer significant insights.
“Figuring how to properly break down this data is the industry challenge now,” Holley said. Identifying and effectively displaying potentially useful information requires figuring out “what do we value, what do we keep, and where is the most value when looking at the distribution of fluids,” he said.
Rethinking Shale Development in the Place Where It Began
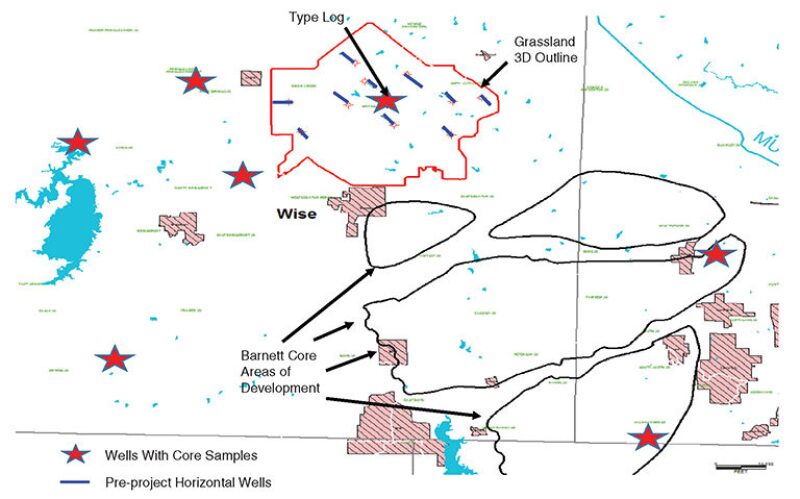
Devon Energy decided in 2011 to develop an area north of its core area in the Barnett shale. The 11 wells drilled northwest of Fort Worth, Texas, showed just enough promise to justify further development, and enough variation to indicate that drilling could be a costly way to figure it out.
Instead, Devon used the area to try a data-driven approach to figure out how to develop a thick shale offering the promise of valuable liquids production, where the output of the previous wells “were all over the place,” said John Spaid, senior geological adviser at Devon.
Spaid and Jeff Dahl, a completions engineer at Devon, led a team of 30 representing the range of professionals required for planning and reservoir development, who were drawn from inside Devon and Halliburton, which collaborated on the project.

Extensive data gathering, from the production history of the wells to 3D seismic, was used to build a model of the Earth, the reservoir, and the fracture networks to be created. Early work pointed to a 60-ft drilling window, which was lower in the large zone than it had been in previous wells.
The team also concluded the fractures created in past wells were not effectively draining the reservoir, and more complex fracture development was needed to remedy that. It led to a new fracture stimulation program that offered an unconventional approach to improved production.
More complex fractures also meant smaller openings—ranging from less than 20% as wide down to less than 10%—and torturous paths with many sharp turns for fracturing fluids loaded with sand to prop open these pathways.
To increase the amount of sand moved along those difficult pathways, the fracturing design used finer sand for proppant—86% of it was 100 mesh sand, up from 20% in the old design—with the result that 30% to 40% more sand was pumped in 20% less water, Dahl said. Another change was pumping a higher concentration of sand at the start of each stage, because their studies suggested that the pathways were opened widest early on and narrowed as the job progressed.
The team used a variety of diagnostic tests to get a detailed look at the reservoir. Microimaging was used to identify natural fracture networks, which were targeted because they were expected to facilitate more complex fracture networks.
Chemical and radioactive tracers were used to track where the fracturing fluid went in the formation and where it did not. The test results were included in the team’s analysis of why some fracturing stages failed to perform as expected.
The 13 wells drilled since they completed the more than 14-monthlong project have been producing nearly twice as much as the initial wells, with far less variation. “We started changing how we fractured wells and improved our results,” Dahl said. “What we wanted to do is improve our results and do it in a cost-effective manner.”
Now the Devon team has been assigned to study how best to develop its acreage in the Eagle Ford. While the methods used will be repeated, the plan is unlikely to be the same. The geology is different in the south Texas fields.
“What works in Barnett may or may not work in the Eagle Ford, and probably will not work in the Marcellus,” Spaid said.
For Further Reading
SPE 168583 New Processes and Tools for Design and Execution to Optimize Hydraulic Fracturing Treatments in Shale Reservoirs by Amit Kumar, Halliburton, John Spaid and Jeffrey Dahl, Devon Energy, et al.
SPE 168612 Economic Optimization of Horizontal Well Completions in Unconventional Reservoirs by Robert Barree, Barree and Associates, Stuart Alan Cox, PetroEdge Energy, et al.
SPE 168596 Stimulated Reservoir Volume: A Misapplied Concept? by Jon Wallace and Craig Cipolla, Hess Corp.
SPE 168603 Application of Integrated Advanced Diagnostics and Modeling to Improve Hydraulic Fracture Stimulation Analysis and Optimization by Robert Barree, Barree and Associates, Mathieu Molenaar and Gustavo Ugueto, Shell, et al.
SPE 168610 Using Distributed Optical Sensing to Constrain Fracture Models and Confirm Reservoir Coverage in the Permian Basin by Eric Holley, Halliburton, et al.


