Efficient water management is crucial for hydraulic fracturing because of the significant volumes of water required and the associated environmental and operational challenges. This article presents the development of a comprehensive, digitized water-management application designed to streamline and enhance the monitoring and management of water resources.
The application integrates real-time data monitoring, advanced analytics, and a holistic view of the water life cycle, covering sourcing, transportation, recycling, and disposal. Key features include water-volume tracking by source, dynamic scheduling, leak detection, and thorough inspections.
The results demonstrate significant improvements in operational efficiency, cost reduction, and regulatory compliance. Future work will focus on integrating machine-learning models to further enhance predictive analytics, optimize water-recycling processes, and improve anomaly detection. This integration holds the potential to transform water-management practices, making them smarter, more efficient, and more sustainable.
Introduction
Hydraulic fracturing is a pivotal process in the oil and gas industry, enabling the extraction of oil and natural gas from shale formations by injecting high-pressure mixtures of water, sand, and chemicals into bedrock. This method has unlocked vast hydrocarbon reserves, driving significant economic growth and energy security. The process, however, is heavily water-dependent, with each well requiring between 3 million and 8 million gallons of water over its lifetime. This immense water usage poses a significant challenge, particularly in regions where water is scarce. Reducing the reliance on fresh water for fracturing, therefore, is essential to minimizing the effects on agriculture and local communities. Additionally, managing produced and flowback water, which often is saline and brackish, adds complexity because it must be treated or disposed of in compliance with environmental regulations. These dual challenges of water use and scarcity necessitate innovative water management solutions in the hydraulic fracturing industry.
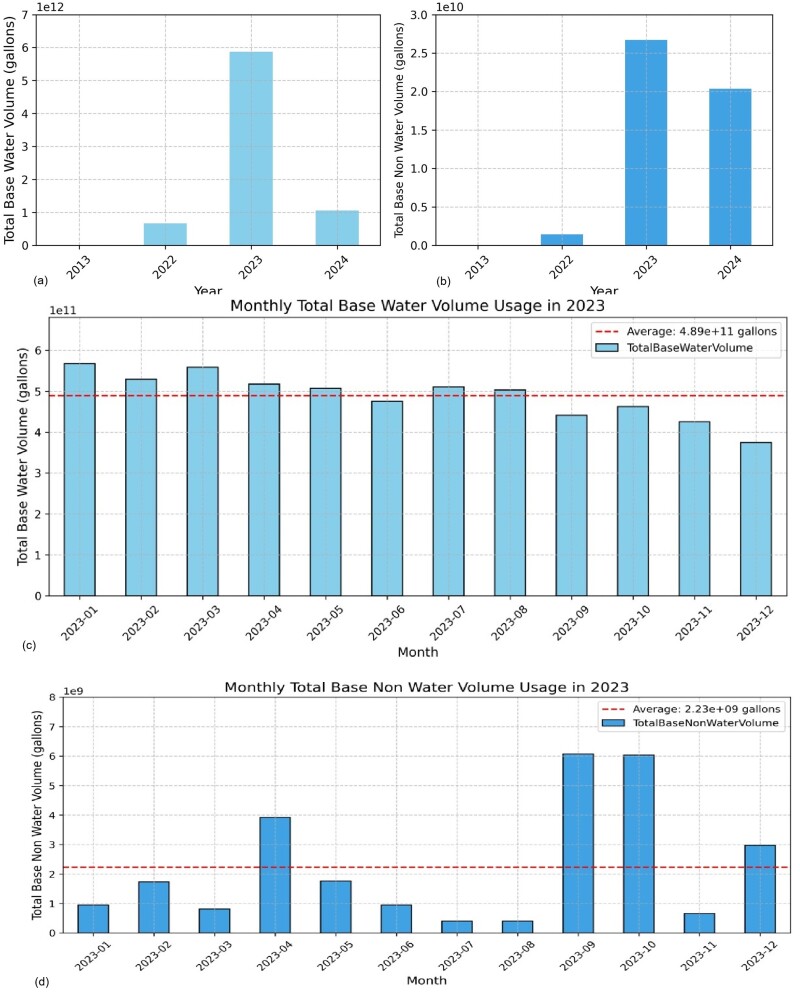
The volume of water used in hydraulic fracturing is substantial, underscoring the critical need for effective water management. Fig. 1 illustrates the annual and monthly total base water and nonwater volumes used as carrier fluids for hydraulic fracturing, based on FracFocus disclosure data covering all US operators. From Fig. 1a, annual water volume spiked to nearly 5.87 trillion gallons in 2023, a significant rise from 667 billion gallons in 2022, indicating an escalating demand for water. Fig. 1c shows that monthly water usage in 2023 averaged around 489 billion gallons with minimal fluctuations. Similarly, Figs. 1b and 1d show the total base nonwater volume increased to 26.7 billion gallons in 2023, up from 1.42 billion gallons in 2022, with notable monthly spikes in April, September, and October, averaging 2.23 billion gallons per month. These trends highlight the massive volumes involved in hydraulic fracturing and the necessity for advanced water management solutions.
There have been many efforts to tackle water management for fracturing in the oil and gas industry, yet these methods show distinct limitations. Liu et al. developed systems for recycling flowback water to reduce freshwater usage, but these methods do not address real-time monitoring and management of water resources, leading to inefficiencies and potential environmental impacts. Similarly, Mohammad-Pajooh et al. and Szép et al. proposed mobile units to treat and reuse produced water on site, but these approaches face high operational costs and logistical challenges. Biswas designed a predictive model to optimize water sourcing decisions based on regional availability and cost, which, despite its predictive capability, lacks integration with operational data and a holistic view of the water management process. Grossmann et al. introduced a method for optimizing the logistics of water transportation in fracturing operations, improving efficiency but not addressing water recycling and reuse comprehensively. Olajire explored advanced filtration technologies to treat produced water for reuse, yet this study does not consider the full life cycle of water management, including storage, transportation, and regulatory compliance. Similarly, Martinez et al. and Kurtz et al. proposed digital monitoring systems for water usage in hydraulic fracturing, but these often lack real-time data integration and advanced analytics, limiting their ability to provide actionable insights and improve overall efficiency.
While significant advancements have been made, existing methods often focus on isolated aspects without providing a comprehensive, digitized solution that integrates real-time data and advanced analytics to optimize full-life-cycle water use holistically.
In this light, a comprehensive, digitized solution to water management in hydraulic fracturing is proposed that addresses the limitations of previous methods. This approach integrates real-time data monitoring, advanced analytics, and a holistic view of the water life cycle, from sourcing and transportation to recycling and disposal. The water management software application allows operators to monitor produced and flowback water volumes continuously, implement dynamic scheduling, and detect leaks in real time.
Unlike previous methods, this solution offers a unified platform that captures and analyzes data from various stages of the water management process, providing actionable insights to optimize water use and reduce costs. By incorporating features such as historical data analysis, predictive modeling, and automated reporting, this system not only ensures compliance with regulatory standards but also supports decision-making and strategic planning.
This integrated approach to water management for hydraulic fracturing offers a robust and scalable solution that can adapt to the varying demands and conditions of different regions.
Description
Historically, fresh water has been essential for the hydraulic fracturing of wells because impurities can diminish the efficiency of additives used in the process. Most water used in hydraulic fracturing comes from lakes, rivers, ponds, and municipal supplies. Groundwater also can be used to supplement surface water supplies where it is available in sufficient quantities.
In some states, the water used for fracturing is regulated by local public agencies or river basin commissions, while, in other areas, water rights are privately owned and can be allocated at the owner’s discretion. Murphy works to use nonfresh water sources, including produced water and saline groundwater. When these alternative sources are exhausted or unavailable and freshwater sources become necessary, the company works to avoid affecting wetlands, streams, ponds, lakes, waters of the US, US Army Corps of Engineers water bodies, and regions with heightened water scarcity. The water use balance for three of Murphy’s areas of operation is detailed in Fig. 2, as presented in Murphy’s 2024 Sustainability Report.
As illustrated in Fig. 2, the water source balance shows varying reliance on different water sources. The Eagle Ford Shale (Fig. 2a) has seen a notable shift, with increased use of recycled water, rising from 11% in 2021 to 17% in 2023, supported by capital investments in recycling infrastructure. Surface water usage has decreased, driven by operational shifts to areas with limited surface water, increasing dependence on groundwater. In Tupper Montney (Fig. 2b), after a peak in recycled water usage at 71% in 2022, the proportion dropped to 35% in 2023 because of longer approval lead times for produced water conveyance. In Kaybob Duvernay (Fig. 2c), the company continues to work to reduce the dependence on surface water and to work with local regulators on water recycling efforts.

Advancing the goal of using recycled produced water required updating the water management monitoring tools. Previously, water volumes of ponds were tracked using spreadsheets, which had several disadvantages, including vulnerability to human error, manual calculations, inadequacy for remote work, lack of real-time data updates, and the risk of data being deleted or lost. To overcome these drawbacks and to add additional features, the Operations and Data Science teams collaborated to develop a water software application. This application allows operators to enter the total measured volume of the pond, the “water in” volume, and the “water out” volume on specific dates. Historical data can also be viewed. Additionally, the app facilitates the tracking of daily and monthly inspections using an inspection checklist. Further development is underway to include leak-detection monitoring.
Water Management Application
The water management application is designed to streamline and enhance the monitoring and management of water resources for hydraulic fracturing operations.
The app is organized into three modules—Water Management, Inspection, and Water Leak Detection. The Water Management module allows users to track and manage the water volumes of various ponds, categorize water by different sources, and log daily activities. The Inspection module enables users to conduct and log both daily and monthly inspections, ensuring that all necessary maintenance and safety checks are completed and documented. The Water Leak Detection module, currently under construction, aims to provide real-time monitoring and alerts for potential leaks by comparing actual measurements against a digital twin model. This feature will enhance the system’s ability to prevent and respond to water loss incidents, thereby improving the efficiency and sustainability of water management in hydraulic fracturing operations.
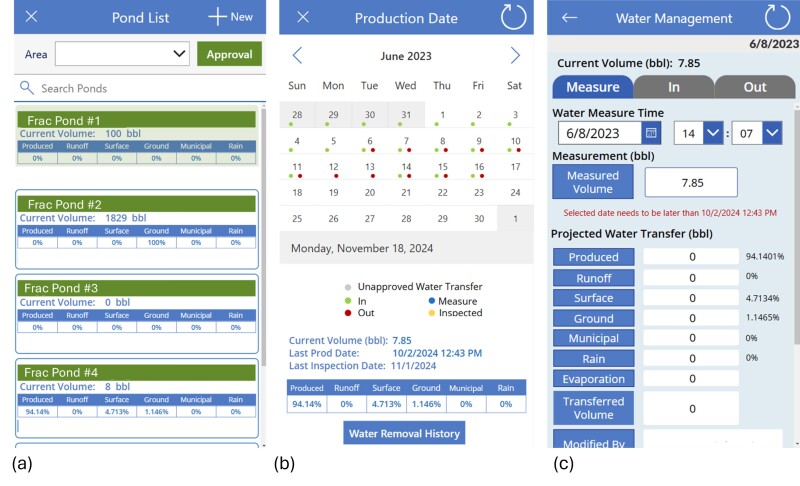
Module 1—Water Management. In this module, the Pond List screen allows users to view and manage the water volumes of various ponds (Fig. 3a). This screen provides a comprehensive overview of each pond’s current volume, categorized by different water sources such as produced, runoff, surface, ground, municipal, and rainwater. Users can filter ponds by area and search for specific ponds by name or identification number. Each pond has three types of actions to be tracked: measuring water level, adding water, and removing water. After selecting a pond, users are presented with a calendar where that presents activities on the pond by day. If users want to add an activity, they select the day on the calendar, which will take them to an input screen. If they want to view the activity history, they can click the History button.
The Production Date screen (Fig. 3b) features a calendar view where users can log and track daily water management activities. Users can select a date to enter new data or view historical records. The screen provides detailed information about water in and out and measurement activities for the selected date, along with current and historical water volume data. The Water Management screen (Fig. 3c) allows users to enter specific measurements, including water volume and time, and to classify the water transfer into categories such as produced, runoff, surface, ground, municipal, and rainwater.
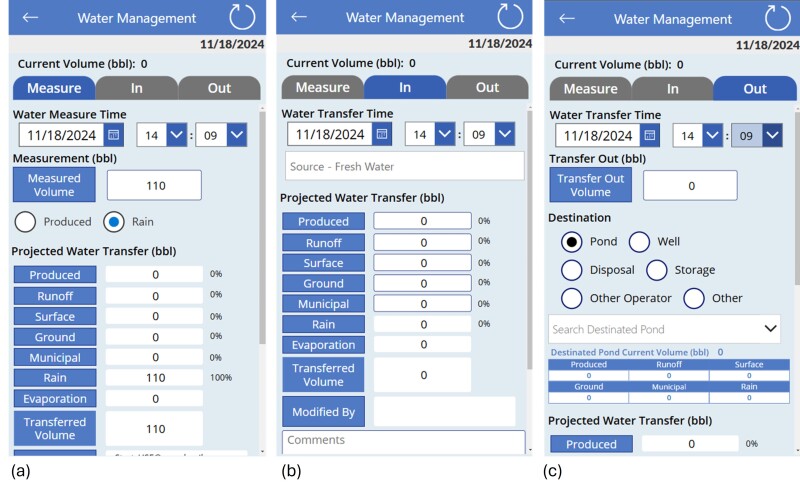
Figs. 4a, b, and c illustrate the detailed entry and classification of water transfer, including measurement, incoming water, and outgoing water activities, respectively.
A pond can have the following three types of actions:
- Measure—Users fill in the Measured Volume and comment section. If the measured volume is lower than the existing volume, the water amount will be deducted based on the existing percentage of each category. If the measured volume is higher than the existing volume, there will be two options for users to choose: Produced or Rain. If the user chooses Produced, the data will be recorded as In, meaning produced water is added in the pond. If the user chooses Rain, the data will be recorded as Measure, and the percentage of Rain will increase. All other category percentages will decrease. The percentage of each category is calculated by the volume of each category divided by the total water volume in the pond.
- In—If users choose the action In, they will fill in the amount of water being transferred into the pond in the five categories of water transfer—produced, runoff, surface, ground, and municipal—and the comments section. The first action of all the ponds is always In. This will provide the first ratios of the five categories. Then the ratios are updated based on the next actions.
- Out—If users choose the action Out, they will enter the volume of water being transferred from the pond and the destination. If the destination is another pond, there will also be an update of In for that destination pond.
Module 2—Inspection. Fig. 5a shows the Inspection Calendar, where users can log and track inspection activities. Users can select a date to add new inspections or edit existing records. Fig. 5b shows the Yard Site Inspection screen, which includes multiple questions that the user must answer. If the answer is Inadequate, the user must provide comments and photos. Fig. 7c shows the Daily Inspection screen, where users can conduct daily inspections by answering predefined questions and submitting the inspection report.
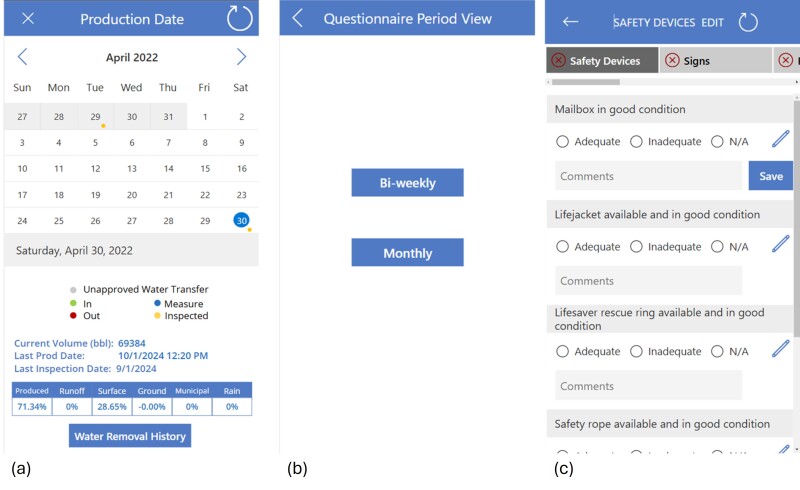
Ponds also need to be inspected to ensure they are qualified for operation. Each pond has daily and monthly inspections, each covering different categories such as structural integrity, water quality, and equipment functionality. Inspectors must complete all these categories before submitting the inspection report. After selecting the Inspection Module, users select the pond from the pond list and are then directed to the inspection calendar. They can add a new inspection by selecting a date without a yellow spot or edit an existing inspection record by selecting a date with a yellow spot. There are multiple questions that users must answer, categorized under headings such as Structural Condition, Water Quality, and Operational Safety, before they can submit the inspection report. If their answer is Inadequate, they must provide comments or a photo. Users can view the inspection report based on the specific question type, which includes these predefined categories, to ensure comprehensive documentation and follow-up actions.
Results
As an internal best practice and in accordance with legislative requirements, water metrics are tracked across all onshore business units. These figures include freshwater consumption, alternative water consumption, alternative water sharing volumes, and freshwater use intensity (barrel per lateral length and barrel per fracture stage). Figs. 6a and b illustrate key water metrics, showing trends in freshwater and recycled water use alongside the number of wells completed from 2019 to 2023.
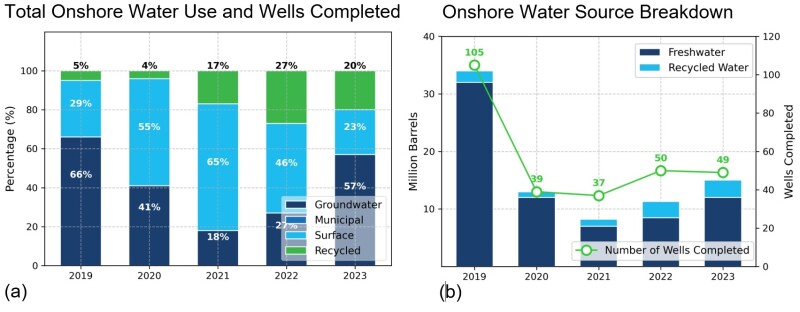
Fig. 6a shows the total water use in millions of barrels and the number of gross wells completed annually from 2019 to 2023. It shows a downward trend in freshwater use over the years, with a notable reduction from approximately 30 million bbl in 2019 to around 25 million bbl in 2023. Concurrently, the number of wells completed also saw fluctuations, with a peak of 105 wells in 2019 and a sharp decline to 39 wells in 2020, followed by a gradual recovery in subsequent years. For instance, the number of wells increased to 50 in 2022 but slightly decreased to 49 in 2023. This decline in freshwater usage, coupled with a relatively stable number of wells, indicates a shift toward more sustainable water use practices, potentially through improved efficiency and increased reliance on recycled water.
Fig. 6b further breaks down the water sources used, showing a significant shift in the composition of water sources over the years. In 2019, the majority of water used was groundwater (66%), with recycled water contributing only 5%. By 2023, the reliance on groundwater decreased to 57%, while the use of recycled water increased to 20%. This trend toward greater use of recycled water is further emphasized by the produced water recycling ratio, which reached 27% in 2022 before slightly decreasing to 20% in 2023. This decrease in the recycling ratio, despite the increased volume of produced water used in 2023, can be attributed to the longer laterals and larger water volumes required for operations.
The observed trends highlight a focused effort to reduce freshwater usage and increase reliance on alternative water sources, particularly recycled water. By providing real-time data and advanced analytics, the application enables operators to make informed decisions about water sourcing, usage, and recycling. The application’s ability to track water volumes, categorize them by source, and monitor inspections ensures efficient and sustainable water management. This is critical not only for compliance with legislative requirements but also for minimizing environmental impacts and optimizing operational costs.
Conclusion
This study tackled the significant challenge of water management in hydraulic fracturing, a process that demands substantial water volumes and poses environmental and operational risks. The primary issue was the inefficiency in managing these water resources throughout their life cycle sustainably while meeting regulatory standards. To address this, a comprehensive, digitized water management application was developed. The solution integrates real-time data monitoring facilitated by meters that feed data into the system, advanced analytics, and a holistic view of the water life cycle, covering sourcing, transportation, recycling, and disposal. The application enables precise tracking of water volumes by source, dynamic scheduling, leak detection, and thorough inspections, which collectively improve operational efficiency and reduce environmental impact. The insights obtained include optimized water use, enhanced recycling rates, and ensured regulatory compliance. Ultimately, the digitized system provides a robust and scalable approach to improving the efficiency, sustainability, and regulatory adherence of water management in hydraulic fracturing operations.
Future Work
Future work will focus on integrating machine learning models into the water management application to enhance its capabilities. The use of predictive analytics aims to forecast water usage trends, identify potential leaks before they occur, and optimize water recycling processes. Machine learning algorithms can analyze historical data to predict water demands, improve the accuracy of inspections by detecting anomalies, and enable adaptive scheduling based on real-time conditions. This integration will lead to significant improvements in operational efficiency, cost reduction, and environmental sustainability. Enhanced predictive capabilities will facilitate better planning and decision-making, ensuring more effective water resource management and contributing to the resilience and reliability of hydraulic fracturing operations.
