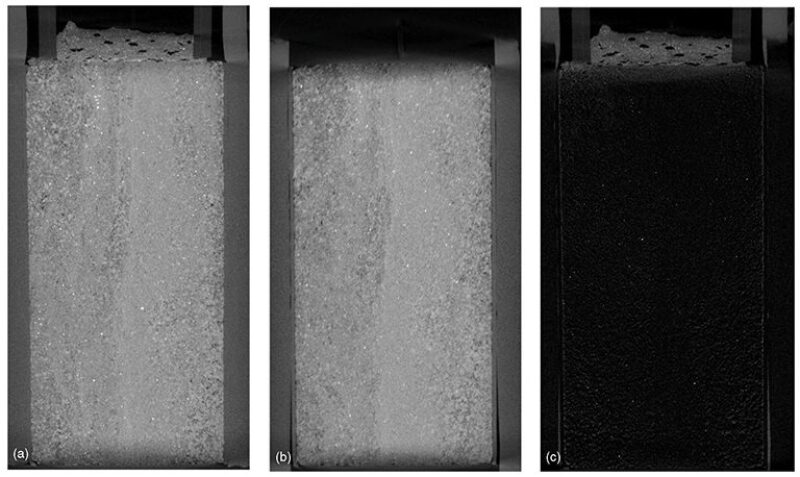
A reservoir-conditions coreflood study was undertaken to assist with design of drilling and completion fluids for a Norwegian field. Multiple fluids were tested, and the lowest permeability alterations did not correlate with the lowest drilling-fluid-filtrate-loss volumes. This paper will examine the factors that contributed to alterations in the core samples.
Introduction
A range of measurements are made during reservoir-condition studies, with typical metrics of the performance of a fluid or sequence including the following:
- Permeability measurements are made at initial reservoir conditions and then again at various points throughout the study.
- Filtrate-loss volumes are used to compare the performance of various fluid types, including bridging design (drilling fluids), activation of crosslinked gels (kill pills), and breakthrough time/rate (treatment fluids).
- Production/injection rates or differential pressures can give some broad indications of cleanup but are generally prone to artifacts or misinterpretation caused by multiple mechanisms occurring simultaneously within samples.
- Visual observations can give an excellent overview of external features of the samples such as drilling-mudcake cleanup and sanding or sample failure or fracturing. However, they do not show what changes have occurred within samples and cannot visualize changes at a microscopic level, and both are generally key to understanding results.
These metrics are unfortunately subject to a number of factors that make interpretation difficult and therefore add risks to the decision-making process.
×


Continue Reading with SPE Membership
SPE Members: Please sign in at the top of the page for access to this member-exclusive content. If you are not a member and you find JPT content valuable, we encourage you to become a part of the SPE member community to gain full access.

