

The noise around climate change can be deafening. The alarmists and media clamor for the public’s attention. As petroleum engineers, we sit in the middle. We are all busy, but should we take the time to really understand the climate? How much warmer will it really get, and how scary will other changes be?
A year ago, I retired from a rewarding petroleum career and promptly took a year informally studying climate science. It is fascinating and complex. I was pleasantly surprised that the 3,000-page report by the United Nations Intergovernmental Panel on Climate Change (IPCC), titled “Climate Change 2021, The Physical Science Basis,” is a very readable consolidation of global research to date.
Here is a summary of some things that surprised me about the science behind the report.
Science Basics
My first surprise was that CO2 levels are rising only about half as fast as we are emitting fossil fuel CO2. It turns out that the oceans and plants are absorbing the other half of the emissions. Excess CO2 dissolves directly into the oceans, while, on land, the plant biomass is expanding in response to the CO2 fertilization effect. These effects are forecast to continue.
Given that 70% of the globe is covered with oceans with an enormous capacity to buffer temperature changes, when we hear global warming numbers quoted, the temperature is more related to sea air temperatures than land. In fact, inland parts of North America and Europe are generally warming about 1.5 times the quoted warming amount. So, if you hear about a 2°C warming case, that may be 3°C where you live.
The physics of the greenhouse effect is well known. Short-wave radiation comes from the sun as visible light. To stay in equilibrium, this energy radiates back to space as long-wave radiation using the T4 relationship we learned as freshman in college.
Without an insulating blanket of gas, our Earth would average −18°C to solve this equilibrium equation. Fortunately, this outgoing radiation has frequencies that can be absorbed by certain atmospheric gasses (H2O and CO2), which capture and re-emit this energy. Some of this re-emitted energy heads up and away toward space, and some comes back to Earth, providing extra warmth. This makes our plant livable at about 14°C on average.
To calculate the warming from additional CO2, a term called “radiative forcing” is used to quantify the energy flux with units of watts per square meter (W/m2).
For CO2 changes in the atmosphere, the additional forcing is given by the equation DF = 5.35 ln(C/Co) where C is the current CO2 level in the atmosphere and Co is 278 ppm. At today’s 420 ppm, this results in 2.20 W/m2 of additional warming energy. This is the largest and highest confidence part of the warming calculation.
Other Important Gases
Methane increases in the atmosphere also have added about 1 W/m2 of forcing, as atmospheric concentrations have roughly doubled in the last 100 years. The petroleum industry and the global population of livestock are approximately equal in driving this.
The gas is so potent because there is initially so little of it.
For the specific radiation frequencies that could get captured by methane, each new methane molecule has a high chance of capturing an outgoing radiation wave.
The good news about methane is that it decays comparatively quickly by means of oxidation in the atmosphere, so an additional emission today is more than half gone in 10 years and almost completely gone in 50 years. On the other hand, CO2 does not decay but tends to be captured by plants and re-emitted when those plants rot, so emissions are more enduring.
A surprising gas is SO2, which has had a significant cooling effect on the earth for the past 60 years with a forcing effect of about −1 W/m2.
It turns out that, besides causing acid rain, burning high-sulfur coal and oil releases SO2, some of which creates aerosol droplets in the upper atmosphere. This acts like a partial shield, reflecting sunlight back to space. SO2 emissions are now dropping, so we are also gradually losing the effects of this sun shield.
Climate System Feedbacks
The most difficult problem for modelers is the climate feedbacks. Will a warmer world cause other changes that will accelerate or reduce warming?
Scientists have analyzed what they call “paleoclimate archives” to assess what we might expect. Extracting ice cores from the 3-mile-thick Antarctic ice sheet can determine both temperature at the time of deposition from the oxygen isotopes in the ice and the atmospheric composition from the gas bubbles entrained in that ice.
One good-news learning from this work has been that permafrost thawing likely won’t cause a dramatic methane release because it didn’t happen during other ice age thaw episodes.
On the other hand, the work shows that, when the world goes through a warming cycle, the Arctic warms significantly more than the rest of the Earth. This suggests that today’s accelerated warming in the Arctic will continue.
A key variable is potential changes to cloud patterns. Low thick clouds tend to reflect the light back to space, which has a cooling effect, while thin high clouds act as a warming blanket. The US National Oceanic and Atmospheric Administration, or NOAA, and others continuously monitor such conditions using satellites.
Temperature Forecasts
So how much warmer will it get? The “Emissions Pathways” from the IPCC diagram shown in Fig. 1 are the most referenced cases.
The upper cases are considered no-climate-policy scenarios and do not represent the path the world seems to be on at present. If you read articles about a dramatically apocalyptic climate future that cite an IPCC document, however, they may be referring to an outcome from the Very High case.
The Low and Very Low scenarios are considered by many to be aspirational given current technologies. The Medium case may be more plausible, with gradual increases in emissions levels for the next 20 or 30 years then dramatic reductions as new technologies come into play.
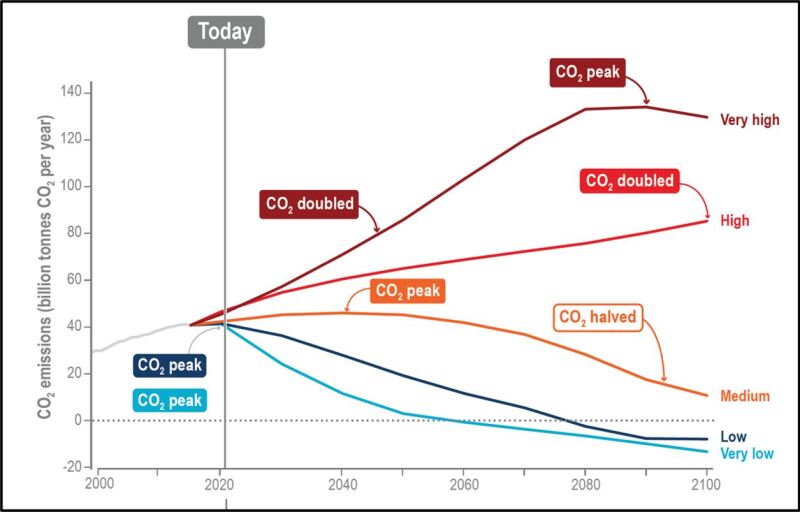
Below are warming forecasts for these scenarios.
For the Medium case, the world warms by about 2.7°C or about 1.6°C warmer than today. Using the 1.5 factor, this suggests your back yard may warm 2.4°C versus today. If you noticed the IPCC scenario names on the chart, the number refers to the DF term discussed earlier, so the Medium case assumes forcing goes to 4.5 W/m2 versus 2.2 W/m2 today.
The IPCC takes uncertainty analysis very seriously in its work, which includes reasonable confidence limits and uncertainty ranges in all their work.
In Fig. 2, the shading represents the P95/P05 confidence intervals for two of the cases. The ranges reflect uncertainty in model assumptions such as cloud behavior and other feedbacks.

Precipitation
At a given humidity, water vapor rises 7% per degree Celsius of warming per the Clausius–Clapeyron equation. When ocean weather hits coastal cities and mountains, we can generally expect 7% more rain per degree Celsius because the clouds hold more water. For desert climates downwind of these mountains, where land is warming faster than oceans, we may get less rain because of the same principle working against us.
It may be interesting to visit your local weather station online and plot annual precipitation and temperature since 1950 for a few locations. In the US, the National Weather Service has excellent data that is easy to download. What I found was that wetter regions have a slight upward trend consistent with the 7%, while no trend can be seen in dryer regions, and that temperatures have been rising like the IPCC suggests.
Extreme Weather
This topic held the biggest surprises for me. My mental paradigm was that the bad weather days would become much worse than changes in the baseline. This is generally not true.
For temperature, the IPCC is very clear is saying that “Changes in local surface temperature extremes closely follow the corresponding changes in local average surface temperature.”
For example, a 2°C shift in average temperature might shift record hot days by 2°C but the number of days above an extreme threshold by 10 times, depending upon the bell curve shape. For an animal or plant that gets sick above a certain threshold, this is a big deal. For a day of golf, it matters less.
The IPCC also shows model results of extreme storm precipitation events. For the maximum 1-day rainfall event over a 10-year or 50-year window, a typical global location at 2°C of warming will have 14% more precipitation versus 1900, consistent with the 7%/°C relationship. For example, a storm with 7 in. of rain will more likely become a storm with 8 in. of rain.
The most difficult challenge for climate modelers is to predict the number and frequency of tornados and hurricanes because of their complex nature. I would encourage you to read the IPCC chapter titled “Weather and Climate Extreme Events in a Changing Climate.” The predictions generally lean toward more tornados and fewer hurricanes, and these storms may have slightly higher wind speeds.
Sea Level Rise
The two components behind sea level rise are the thermal expansion of the oceans as temperatures rise and the loss of land ice as glaciers and ice caps melt. The current 4-in. rise over the past 50 years can be reconciled from average physical measurements of sea level and the theoretical rise from temperature-probe data along with satellite-based ice volume data. For context, this is less than some areas are subsiding for geological reasons.
Eventually, this could become a bigger problem. The IPCC Medium case shows sea level rise versus today of 1–2 ft by 2100 and 2–4 ft by 2150.
The range is wide because of the tug-of-war between increased warming and increased snowfall on the ice sheets. Notice how the ocean rises post 2100 even though this case is almost net-zero emissions at year 2100. This is because of ocean temperature gradually catching up to land warming.
The Engineer’s Role
Like it or not, our activities are at the center of the climate debate. Consider reading a chapter in the IPCC document when you need a break from your engineering duties.
Surely the world is better positioned to address the climate challenge if more of us understand the science. And the next time you are in the pub and hear sensationalized climate arm-waving, hopefully you can be the engineer in the room to put some numerical context on the issue and bring the topic down to Earth.
