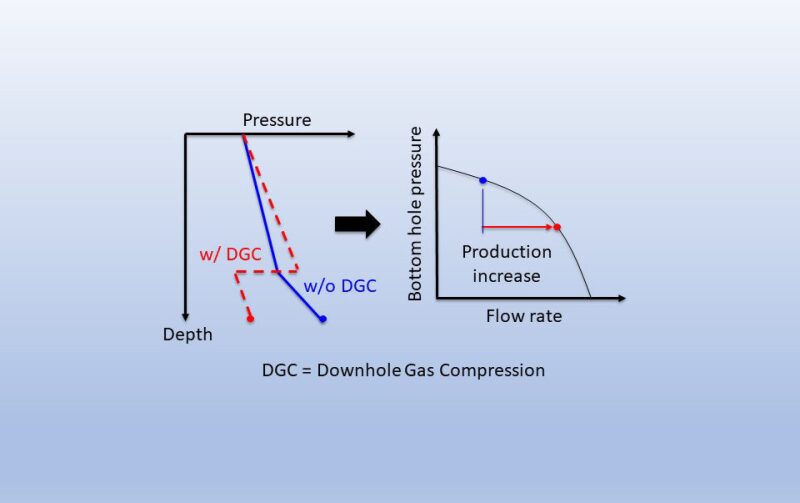
The dynamics of wellhead gas compression are widely understood within the oil and gas industry, however the dynamics of downhole gas compression are still being analyzed and debated. For oil wells, increasing the drawdown near the sandface by applying artificial lift (AL) technologies downhole improves the production of hydrocarbons. In principle, a similar improvement should occur for gas production when drawdown is increased by applying downhole gas compression close to the pay zone.
Extensive analysis has led to the following conclusions: downhole gas compression provides a greater increase in gas production than wellhead gas compression by creating more drawdown; downhole gas compression requires one-fourth of the energy required by wellhead gas compression; and downhole gas compression reduces liquid loading by increasing the gas temperature and velocity in the well.
Increased Gas Production
One way to understand the mechanism of higher gas production rates by downhole gas compression, in comparison with wellhead gas compression, is to recognize that gas density at the bottom of a gas well is higher than gas density at the surface. The hydrostatic pressure of the gas column from the bottom of the well to the surface creates a higher bottomhole pressure, which in turn increases the gas density at the bottom.
Because the mass flow rate is the product of gas density and volumetric flow rate, the higher gas density at the bottom hole results in higher mass flow rates at the same volumetric flow. Therefore, putting a compressor downhole will move more gas than the same compressor on the surface.
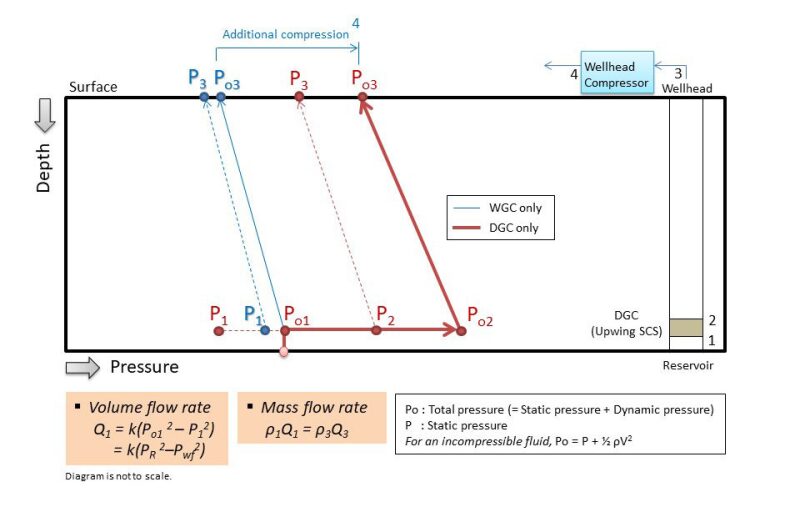
To demonstrate the benefits of downhole gas compression graphically, a “normal well” example, based on simplified calculations, is illustrated in Fig. 1. In this example, all calculations assume Amarillo gas properties (REFPROP). To compare downhole gas compression (DGC), represented by the red lines, with wellhead gas compression (WGC), represented by the blue lines, we start from the same ambient pressure and temperature for both at the wellhead (station 3). By assuming constant gradients of pressure and temperature along the depth of 1,000 ft of the well [Nelson and Kibler 2005], we then estimate the bottomhole pressure and temperature (station 1).

The same Mach number of 0.2 for gas flow was assumed at both the downhole compressor intake (station 1) and the wellhead compressor intake (station 3). Based on the assumptions above, the static pressures at the downhole compressor intake (P1) and the wellhead compressor intake (P3) can be calculated from enthalpy and entropy.
In the approach of Beggs (1991), the volumetric flow rate of a gas well is assumed to be proportional to the difference between squared reservoir pressure and squared wellbore flowing pressure (PR2 - Pwf2) in a gas well. Commonly, drawdown is defined as the difference between reservoir pressure and wellbore flowing pressure (PR - Pwf). Therefore, Beggs’ approach essentially describes the fact that higher drawdown will generate higher gas production.
At the intake of a compressor, the difference between the total pressure and static pressure is called dynamic pressure. The static pressure at the downhole compressor intake (P1 in red) is equal to the wellbore flowing pressure (Pwf); the total pressure (Po1) is equal to the reservoir pressure (PR). The drawdown with the downhole compressor is Po1 - P1 in red, which is also the dynamic pressure at the downhole compressor intake. For the wellhead gas compressor, the drawdown at the bottom hole by the wellhead compressor operating on the surface is Po1 - P1 in blue.
In Fig. 1, the higher drawdown (Po1 - P1 in red) by the downhole compressor leads to about 63% higher volumetric flow compared with the wellhead compressor based on the volumetric flow equation (Beggs).
Compared with the higher dynamic pressure at the downhole compressor intake, the wellhead compressor will further lose the dynamic pressure along the depth of the gas well because of the friction between the gas flow and wellbore. This friction effect, which is not taken into account in the present example to simplify the calculation, will reduce the drawdown at bottom hole when the wellhead compressor is applied.
Reduced Energy Consumption
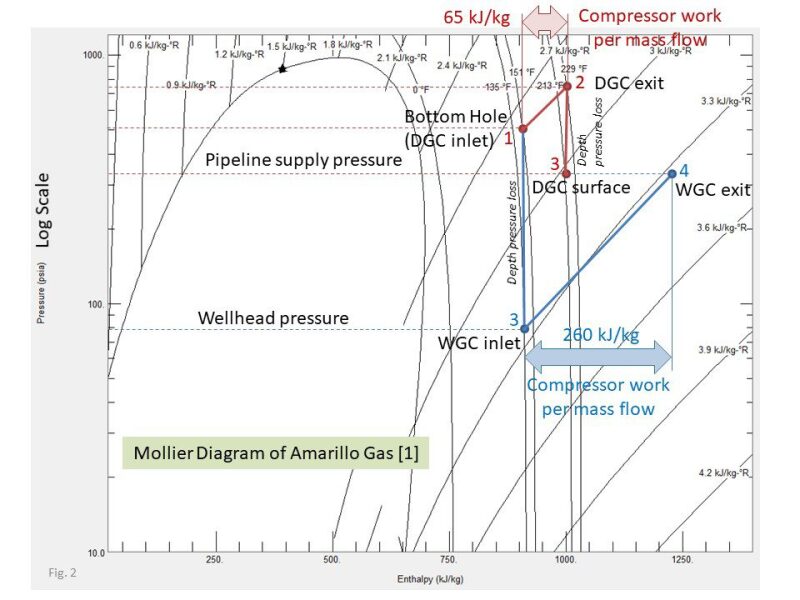
Another comparison to be considered between downhole compression and wellhead compression is power consumption. In Fig. 2 if we assume a constant mass flow rate, the discharge pressure of the downhole compressor on the surface (3 in red) will be higher than the intake pressure of the wellhead compressor (3 in blue). If the discharge pressure on the surface with the downhole compressor (P3 in red) is assumed to be the pipeline supply pressure, the wellhead compressor will have to keep compressing gas until the discharge pressure of the wellhead compressor reaches position 4 in blue.
The enthalpy increase required to reach the pipeline supply pressure is the compressor power consumption. In the current example, the wellhead compressor requires a power consumption about four times higher than the downhole compressor to reach the same pipeline supply pressure as shown in Fig. 2.

Abatement of Liquid Loading
It is known that for a gas well producing liquids, there is a critical gas velocity above which the gas can carry liquid droplets from the bottom to surface (Turner et al. 1969 and Coleman et al. 1991).
In the early phase of gas well, a natural flow stream from the bottom of a well to the surface has enough momentum driven by a high pressure differential to carry liquid droplets. As the gas well keeps producing, it gradually loses the momentum to carry liquid droplets because of the natural decline of the reservoir pressure, leading to liquid dropout in the wellbore and eventually the rise of liquid levels at the bottom of the gas well. The rising liquid column exerts back pressure on the reservoir and eventually overcomes the natural drive and stops the gas production.
Recent studies show that in horizontal wells, the bend section requires significantly high critical velocity, causing partial loading for most of the life of the well. In horizontal wells, liquid loading can lead to additional issues, such as severe slugging, low run-life of AL equipment and reduced permeability of a stimulated formation. To mitigate liquid loading, one can apply a downhole compressor in gas wells to both increase current gas production and delay well abandonment by increasing drawdowns, which increases the momentum of the gas flow.
The downhole compressor has a high dynamic pressure (Po2 – P2, in red of Fig. 1) at its discharge (station 2 in Fig. 1). Compressed gas with a high Mach number provides high momentum to carry liquid droplets to the surface. Also, the elevated gas temperature because of compression at the downhole compressor’s discharge is beneficial to prevent the condensation of liquid in the wellbore. In Fig. 2, the temperature range along the depth of the gas well, when the downhole compressor is used (2 to 3 in red), is always higher than that of the wellhead compressor (1 to 3 in blue).
Based on the analysis presented for a simulated well with a depth of 1,000 ft, a downhole compressor is a better choice than a wellhead compressor for increasing gas production. A downhole compressor provides more drawdown, which equates to 63% more gas production. It carries out significant liquids by increasing gas temperature and velocity, and requires one-fourth of the energy to achieve the same mass flow rate. These benefits are enhanced for wells deeper than 1,000 ft.
A downhole compressor is not to be confused with or substituted for a topside boosting compressor, which is still required to transport gas. However, when compared with a wellhead compressor, a downhole compressor will achieve better profits for operators from higher production rates, lower operating costs, and less downtime because of the mitigation of liquid loading. The production gained will contribute to the increase of free cash flow and the increase of hydrocarbon reserves, thus making positive impacts on both operators’ income statements and balance sheets.
References
Beggs, H. D. 1991, Production Optimization Using Nodal Analysis.
Coleman, S. B., Clay, H. B., McCurdy, D. G. et al. 1991. A New Look at Predicting Gas-Liquid Load-Up, J. Pet Technol 43 (3): 329–333.
Nelson, P. H. and Kibler, J. E. 2005. Formation Pressures and Gas-Flow Rates From Well Tests, Southwestern Wyoming Province, Wyoming, Colorado, and Utah. Petroleum Systems and Geologic Assessment of Oil and Gas in the Southwestern Wyoming Province, Wyoming, Colorado, and Utah, USGS.
REFPROP, Fluid Thermodynamic and Transport Properties Database, National Institute of Standards and Technology.
Turner, R. G., Hubbard, M. G., and Dukler, A. E. 1969. Analysis and Prediction of Minimum Flow Rate for the Continuous Removal of Liquids From Gas Wells, J. Pet Technol 21 (11): 1475–1482.

