There is an increasing need to understand the strength and durability of subsea wellheads and conductors. Recently, in-situ monitoring of drilling-riser and wellhead response has been used for projects in the Gulf of Mexico and the North Sea. Wellhead-fatigue-life predictions, for which minimal in-service validation has traditionally been available, have been found to be conservative by factors of 10 or greater on the basis of the field-measurement data collected.
Fatigue of Subsea Equipment
Fatigue is a mechanism of progressive and localized structural damage and occurs only when a material is subjected to cyclical loading. Fatigue damage can occur even when a structure experiences loads that generate stresses significantly below the elastic yield strength of the material. Because subsea wellheads are exposed to constantly varying loads of high magnitude, their fatigue response is of particular concern.
The fatigue life of a component is greatly affected by the likelihood that flaws exist within it and by the complexity of its geometry. If welds are included in the manufacturing process of a component, or are used to join components, crack-like flaws will be introduced. Alternatively, the presence of sharp corners, notches, holes, or threads leads to concentrations of stress in certain areas of a component. The ratio of the maximum stress in such an area to the average stress in the component is termed the stress-concentration factor (SCF) or the stress-amplification factor (SAF). The higher the SCF or SAF, the shorter the fatigue life under a given regime of load cycling.
There are two primary mechanisms by which environmental loads cause fatigue of offshore structures. These are vortex-induced-vibration (VIV) fatigue, driven by current loads, and wave--induced fatigue, caused by wave loading. VIV fatigue occurs if the frequency with which vortices are shed from the leeward side of the riser, a natural effect for a cylindrical body placed in flow, matches one or more of the natural frequencies of vibration of the riser and conductor system. These rapid oscillations generate significant stress fluctuations and can cause significant fatigue damage very quickly. By contrast, wave-induced fatigue is a constant effect, but generally results in lower fatigue--damage rates at the wellhead. This is because wave loading will excite the upper portion of the riser, creating loads and motions that are transmitted down to the wellhead. Hydrodynamic damping and inertia associated with the lower riser portion will act to reduce these motions. For specifications of both VIV- and wave-induced-fatigue monitoring systems, please see the complete paper.
Besides the wellhead and connector, areas of concern include the welds between the wellhead and the adjacent pipe and the seam weld in the conductor pipe. A typical SCF in one of these welds is approximately 1.3, generated primarily from the geometric misalignment and ovality of the components on either side of the weld. However, because of flaws and residual stresses induced by the welding process, the minimum fatigue life may occur in the weld despite the lower SCF. Subsea wellheads are positioned below the blowout preventer (BOP), the primary control mechanism for the well, and therefore are critical in ensuring that well control can be maintained. Furthermore, inspection of these components for flaws after installation is not feasible. These factors lead to the application of a safety factor that can cause analytical fatigue-life predictions to fall short of the target life.
Case Study
Riser and Vessel Arrangement. The monitored well is an exploration well in a water depth of approximately 400 m and is drilled by use of a fourth-generation moored semisubmersible mobile offshore drilling unit. Before operations, both the strength and the fatigue response of the system were analyzed. The fatigue assessment included both first-order- and VIV-fatigue analysis.
Predicted Response. The first-order (wave) -fatigue analysis predicted minimum fatigue lives of approximately 20 days in the weld between the low-pressure wellhead housing and the conductor and of approximately 75 days in the conductor seam weld. With an appropriate safety factor applied, these results dropped to 2 and 7 days, respectively. Both results fall well below the design target of 300 days for well operations with the BOP connected to the wellhead. These poor results were thought to be caused by resonance of the system and of the BOP in particular, induced by the frequencies of the most commonly occurring waves matching the natural frequency of the system. By contrast, the minimum factored VIV--fatigue life, also in the weld between the outer wellhead housing and the conductor, was found to be in excess of 3.5 years and therefore was not a concern.
In light of the inadequacy of predicted first-order-fatigue lives, recommendations were made for improving fatigue-life prediction through removal of conservatism in the analysis model. The sensitivity studies recommended including consideration of varying mud weight, directionality of wave loading, and improvement in the accuracy of the hydrodynamic properties assigned to the subsea BOP stack. Despite some improvement being generated by these studies, the improvement in fatigue life was insufficient to remove all concern over the performance of the system. Thus, a structural-monitoring system was procured to allow the response of the drilling riser to be recorded. For a description of the monitoring system, please see the complete paper.
Comparison of Measured and Predicted Results. Comprehensive weather data at the well location, including current profiles through depth, significant and maximum wave heights, and peak and mean zero crossing-wave periods, are available for the period of operations. Both wave and current data are given with associated flow directions. These data are used to perform a comparison between the measured and predicted results, with a view to establishing the conservatism inherent in the wellhead-fatigue-life prediction.
The comparison between measured and predicted results is conducted by running first-order-fatigue analysis with the full wave scatter measured during the operations. This results in a predicted fatigue life in the riser, at the location of the strain-gauge array, of approximately 22 years. The cumulative fatigue damage calculated from the curvature data recorded by the strain-gauge array equates to an annual fatigue damage of 2% and, hence, a fatigue life of approximately 47 years. On the basis of this comparison, the original analysis model is shown to overpredict fatigue damage, in the riser at least, by a factor of approximately 2.11.
The value of this conclusion for verifying wellhead fatigue is limited because it is plausible that the discrepancy between measured and predicted response will vary along the riser and conductor system. To investigate the wellhead response in more detail, the acceleration output of the analysis is compared with the measured data for five individual 3-hour seastates (Table 1) representing a variety of weather events.

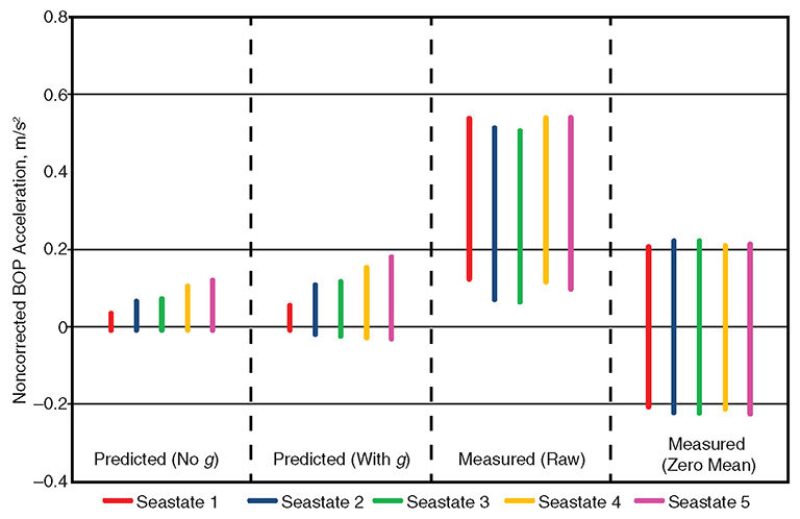
A half-hour analysis simulation is run for each of the five seastates with the original analysis model. From each seastate analysis, time traces of acceleration at the accelerometer location at the top of the BOP are extracted. Time traces in two horizontal directions are created, from which a representative value is calculated by taking the maximum of resultant accelerations at 5° intervals around the riser per the method applied to the measured data. To compare BOP inclinations, summary statistics of both the measured data and analysis results are plotted against each other in Fig. 1. Four sets of results are plotted, each showing the mean acceleration ± 2 standard deviations.

To add g-contamination to the analysis-model results, time traces of rotation around both horizontal axes are extracted from the model. The gravitational acceleration that the rotation would induce in each accelerometer is calculated for these angles at each timestep. The result is added to, or subtracted from, the horizontal acceleration time trace appropriately for the direction of the rotation. The revised time traces are then resolved at 5° intervals to create a single g-contaminated time trace.
It is evident from Fig. 1 that magnitudes of the BOP acceleration measured by the accelerometer array are typically 3.5 to 6.0 times larger than those predicted by the analysis model. This underprediction reduces, particularly for more-onerous seastates, when g-contamination is added to the analysis results. Finally, there is far greater variation in the seastate results in the analytical prediction than in the measured response.
On first inspection, these results imply that the predicted wellhead-fatigue life may in fact be underconservative because the acceleration variations of the BOP in the model are significantly lower than those measured. Hardware failure is ruled out as a source of error through post-retrieval testing. Therefore, in order for larger motion of the BOP to occur, some inaccuracies must be present in the model.
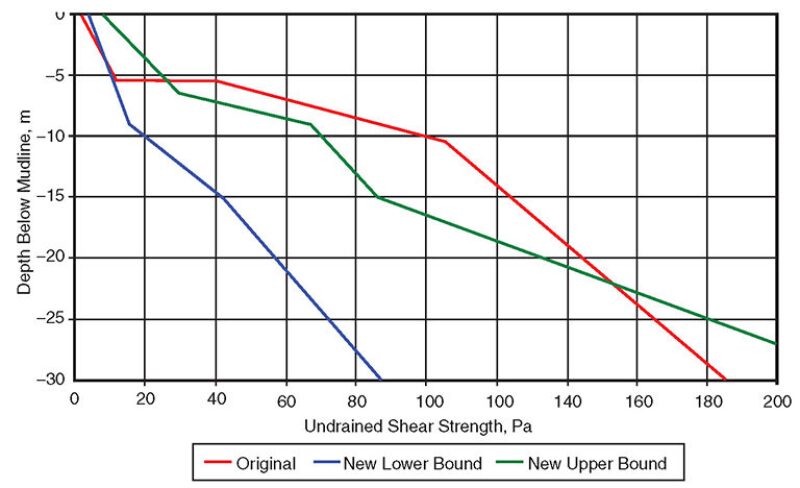
As described previously, both soil stiffness and vessel motion can have a significant effect on the shape and magnitude of the expected bending--moment peak at the seabed. Inaccuracies in the modeling of vessel-motion response would have caused similar discrepancies in the upper-riser response. However, because the upper-riser bending response has been shown to be overpredicted by a factor of approximately 2, rather than underpredicted by a factor of 3.5 to 6, it is unlikely that vessel motion is the most significant source of discrepancy. Therefore, the effect of soil stiffness is investigated. In addition to the soil-strength profile considered in the original analysis, further soil data from a nearby location are available. These additional data are used to generate the extreme lower- and upper-bound profiles plotted in Fig. 2.

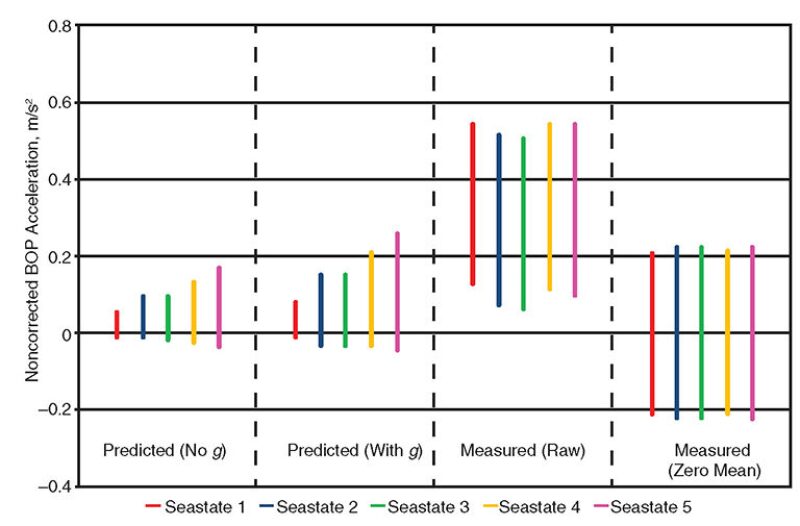
Overall, there is significant difference in the soil strength even within the first 10 m of soil, within which the bending-moment peak is likely to lie. The effect of the variation from 5 m down is investigated by repeating the seastate analysis described previously, with the original soil (red line) in Fig. 2 replaced with the lower-bound soil (blue line). The results are plotted in Fig. 3.

The change in soil is shown to increase the predicted BOP accelerations from the base-case results. When g-contamination is added, the latter seastates demonstrate predictions smaller than the measured results by a factor of 2 or less. This suggests that the soil modeling used in the original analysis assumes stiffness greater than that actually present at the precise well location. However, the variation across seastates remains much greater in the predicted response than in the response recorded during operations. This may be indicative of another flaw in the model.
The modeling of the BOP stack is another potential cause of inaccuracy. The BOP is modeled as a solid, cylindrical section. In reality, this is not the case, with a typical stack containing many gaps and passages between its component sections that permit the through-passage of the water column. Such through-flow would reduce the inertia associated with the stack, particularly in lighter seas, and hence the actual BOP would demonstrate greater motion than would the modeled simplification.
This article, written by JPT Technology Editor Chris Carpenter, contains highlights of paper OTC 23981, “Evaluation of Wellhead Fatigue Using In-Service Structural-Monitoring Data,” by Phil Ward, Alex Rimmer, and Hugh Howells, 2H Offshore, prepared for the 2013 Offshore Technology Conference, Houston, 6–9 May. The paper has not been peer reviewed. Copyright 2013 Offshore Technology Conference. Reproduced by permission.

