An experimental study of liquid loading of gas wells has been conducted with air/water flow in a 3-in. pipe at well deviations of 0, 15, and 30° from vertical. A total of 131 tests have been carried out; differential-pressure gradient and liquid holdup were measured. Flow pattern was observed, and critical gas velocity, which defines the threshold for liquid accumulation in a well (commonly termed liquid loading), has been identified.
Introduction
During the production of gas wells, liquid loading is considered one of the most important production problems. Symptoms of liquid loading include liquid slugging at surface equipment, declining or erratic water- and gas-production rates, and dramatic changes in wellhead pressure. Left unchecked, the water accumulation in the well increases the backpressure against the reservoir and provides a damage mechanism by saturating the near-well region with water.
Critical gas velocity is the key parameter in describing liquid loading. There are three definitions of critical gas velocity used in the literature:
- The minimum gas velocity at which the largest liquid droplets entrained in the gas core can be transported upward, as used in the criterion of Turner et al. (1969).
- The gas velocity at which the flow pattern changes from annular flow to intermittent flow.
- The gas velocity at which liquid film starts to move up the pipe wall continuously.
The Turner et al. criterion has been used widely in the industry to predict critical gas velocity for the past several decades. This criterion is based on a force balance on a single droplet entrained in the gas core. It was proposed that the gas well loads up when the entrained droplet moves downward, which is called droplet-flow reversal. Turner qualified the use of the model by stating that the velocity result should be increased by approximately 20% to ensure liquids do not accumulate in the well. The Turner et al. droplet model is based on a vertical configuration and does not include the influence of well deviation on critical gas velocity. This may explain the poor behavior of the Turner et al. model on field data from deviated wells.
The liquid-loading mechanism is still under debate. The majority of existing models are modifications of the Turner et al. droplet model, each with some degree of success in matching the field data. However, film-flow reversal now seems to be the main mechanism, on the basis of observations in the most recent experimental studies. This criterion is adopted in this study to describe the loading initiation in vertical and deviated wells.
Experimental Facility
Multiphase-Flow Loop. The 76.2-mm (3-in.) -diameter multiphase-flow, fully inclinable facility of the Tulsa University Fluid Flow Projects (TUFFP), with a total length of 17.5 m, has been modified for this project. The test section can be inclined from horizontal to vertical. A 3-in. valve and bypass are used to control the flow rate. The outlet of the flow loop is open to atmosphere, so no backpressure is imposed at the outlet.
Measurements and Instrumentation. The pressure is measured with three pressure transducers, two absolute and one differential. All pressure taps are located at the top of the pipe. Liquid holdup is measured by trapping the fluids between the quick-closing valve sections. These consist of two 76.2-mm (3-in.) ball-type quick-closing valves. A drainage valve is installed in the section near the upstream part of the loop. To measure the liquid holdup, fluids are trapped, and then the boom is lowered to a horizontal position. Liquid is drained through the drainage valve, and the volume is measured. Flow pattern is identified by recording the flow behavior through an acrylic observation window by use of a high-speed-video recording system. The superficial gas velocity varies from 10 to 35 m/s at typical intervals of 2.5 m/s. The superficial liquid velocity varies from 0.005 to 0.1 m/s. Pipe deviations are 0, 15, and 30° from vertical.
Experimental Results
Testing Results for Vertical Pipes. Liquid loading has been studied by considering five different superficial liquid velocities. For a given liquid velocity, the initial superficial gas velocity is set at 30 m/s. From this point, the superficial gas velocity is gradually reduced by steps of 2.5 m/s until reaching a superficial gas velocity of 10 m/s. Two-phase-flow parameters have been acquired for these conditions, including the initiation of liquid loading.
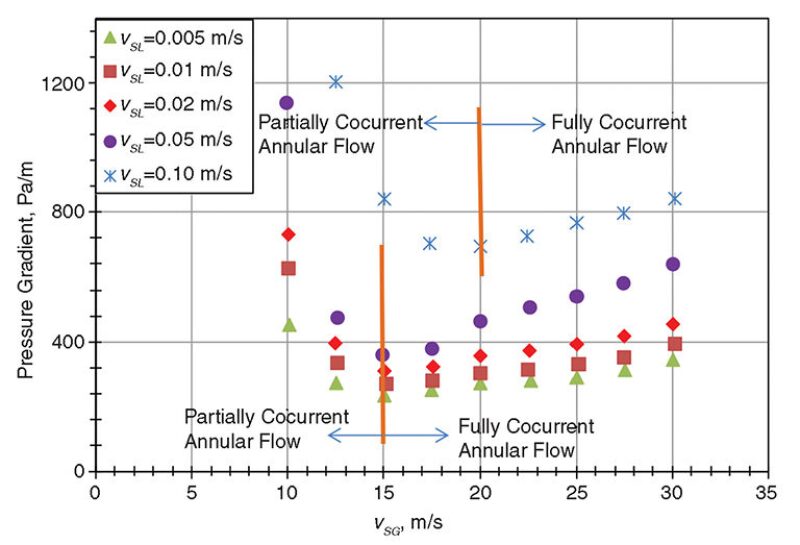
Pressure Gradient. The initiation of the liquid loading is related with a minimum in the pressure drop with respect to the superficial gas velocity. Fig. 1 shows the trend of the pressure gradient vs. superficial gas velocity vSG for five different superficial liquid velocities vSL. For constant vSL, the reduction in vSG results in a reduction of the pressure drop reaching a minimum. At this point, the wall shear stress oscillates around zero and interfacial shear stress is balanced entirely by gravitational forces.

Liquid Holdup. For all the data, the average liquid holdup HL monotonically reduces as vSG increases. At the transition point, HL varies from 0.028 (vSL=0.005 m/s) to 0.06 (vSL=0.1 m/s). The rate of change of holdup with respect to vSG (ΔHL/ΔvSG) is different for fully cocurrent annular flow and partially cocurrent annular flow.
Testing Results for 15° Deviated Pipe. For a 15° deviated pipe, liquid loading has been studied by considering five different superficial liquid velocities using the same procedure as was used in the vertical pipe. Fully cocurrent annular flow has been observed at initial superficial gas velocity with an asymmetric liquid-film distribution. Flow behavior is somewhat different from that of vertical pipes. The following subsections present the behavior of two-phase-flow parameters as a function of superficial gas and liquid velocities.
Pressure Gradient. These data show a trend and behavior similar to those for vertical pipe. For constant vSL, the reduction in vSG results in a reduction of the pressure drop reaching a minimum. For vSL of 0.005 and 0.01 m/s, pressure gradient reaches a minimum value at vSG=17.5 m/s. For vSL of 0.02 and 0.05 m/s, pressure gradient reaches a minimum value at vSG=20 m/s. For vSL=0.1 m/s, the minimum pressure gradient is reached at vSG=25 m/s.
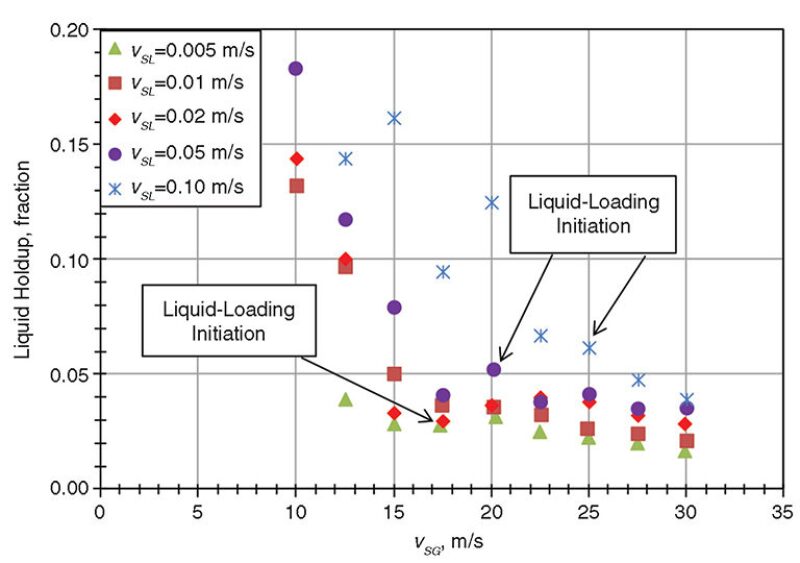
Liquid Holdup. Average liquid holdup vs. superficial gas velocity is presented in Fig. 2. Generally, the average liquid holdup tends to increase as vSG decreases. However, a nonmonotonic trend is observed owing to sampling effects in slug flow.

The holdup values reported at the minimum pressure gradient are in the same range as that given by the vertical flow (0.028<HL<0.06). The rate of change of holdup with respect to vSG (ΔHL/ΔvSG) is different for fully cocurrent annular flow and wavy annular flow. These results suggest that the loading starts at lower superficial gas velocities as compared with the two previous criteria.
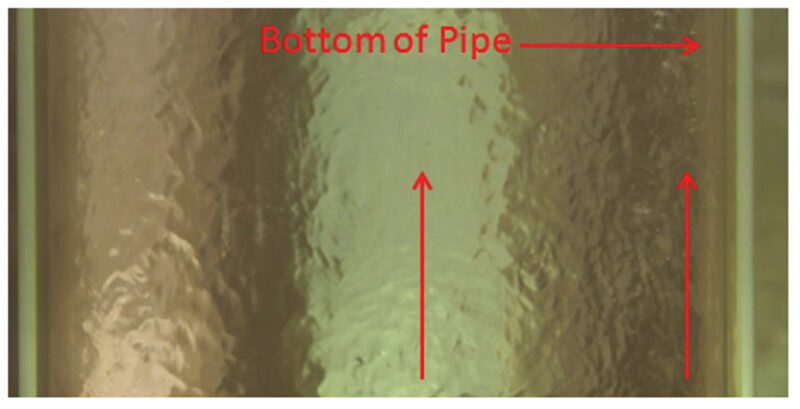
High-Speed-Video Analysis. The image in Fig. 3 corresponds to vSL=0.01 m/s and vSG=22.54 m/s. The pipe is unloaded, and the flow pattern is annular. Droplets entrained in the gas core are flowing upward, and most of the time, the liquid film also flows upward. A small portion of the liquid film near the pipe wall flows downward for a very small period of the video. Additionally, droplets are depositing on the liquid film, creating a circular shape on the liquid film, which was also observed in the vertical-pipe experiments.

After comparison of minimum pressure gradient, maximum pressure fluctuations, and liquid-holdup sharp-increase criteria, the minimum pressure gradient and maximum pressure fluctuations exhibit better agreement with the observed critical velocity. Sharp increase of liquid holdup can be considered as one of the liquid-loading symptoms.
Model Comparisons
Pressure Gradient. The measured -pressure-gradient data are compared with the predictions from the TUFFP unified model. Data are divided into different groups according to the well deviation. The TUFFP unified model does not show good agreement with the experimental data. A majority of the data lie in the range of ±50% of the predictions. Comparisons with pressure--gradient data are divided further into two groups, with respect to loading or no-loading conditions. The TUFFP unified model underestimates the pressure gradient within 50% for the majority of the no-loading test points. For loading cases, the data points scatter within the ±50% region. These disagreements may result from the flow-pattern transitions predicted by the TUFFP unified model. On the basis of flow-visualization results, noncocurrent annular flow and film-flow reversal were observed between the annular- and churn-flow regions.
Liquid Holdup. Average liquid-holdup data are also compared with TUFFP-unified-model predictions. Large differences exist between the test data and model predictions. The model underpredicts liquid holdup for most of the data points. When the flow pattern is identified as slug, the TUFFP unified model predicts the liquid holdup as approximately 0.09, while the test data vary from 0.02 to 0.20. The main reason for this discrepancy could be that the model does not consider liquid entrainment in gas for the slug-flow region. This assumption is not true around the transition boundary between slug and annular flow. Comparisons with liquid-holdup data are divided further into two groups for loading and no-loading conditions. For the no-loading cases, the TUFFP unified model underpredicts the liquid holdup for most data points except for some tests of vertical wells and 15° deviated wells. For the loading cases, most of the predictions are approximately 0.09, with the flow pattern identified as slug by the model, while the measured holdup changes from 0.02 to 0.20.
Critical Velocity. According to the established liquid-loading criteria, critical gas velocity is determined for each well deviation and superficial liquid velocity. Measured results are compared with predictions from different models. Experimental data are compared with flow-pattern transition boundaries predicted by the TUFFP unified model. In the experiments, annular and intermittent flows are observed as the dominant flow patterns. However, the liquid film of the annular flow experiences slowdown and temporal reversal at the onset of liquid loading. This happens around the transition boundary between annular and intermittent flow.
Because the Turner et al. model does not consider the effect of well deviation, it gives a constant critical gas velocity of 14.6 m/s for all well deviations and liquid velocities. Nevertheless, it gives a very good prediction for critical gas velocity for vertical wells and vSL lower than 0.1 m/s. For vertical wells, the TUFFP unified model overpredicts the critical velocity. For the highest superficial liquid velocity vSL=0.1 m/s, the TUFFP model performs better than the Turner et al. model.
Reference
Turner, R.G., Hubbard, M.G., and Dukler, A.E. 1969. Analysis and Prediction of Minimum Flow Rate for the Continuous Removal of Liquids From Gas Wells. J Pet Technol 31 (11): 1475–1482.
This article, written by JPT Technology Editor Chris Carpenter, contains highlights of paper SPE 164516, “An Experimental Study on Liquid Loading of Vertical and Deviated Gas Wells,” by G. Yuan, E. Pereyra, and C. Sarica, SPE, University of Tulsa, and Robert P. Sutton, Marathon Oil, prepared for the 2013 SPE Production and Operations Symposium, Oklahoma City, Oklahoma, USA, 23–26 March. The paper has not been peer reviewed.
