

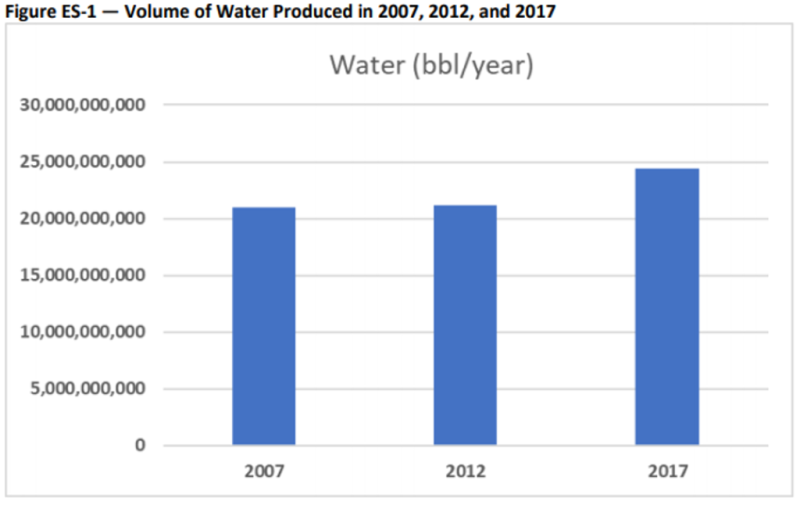
The total volume of produced water estimated for 2017 has increased by 16.2% over a 10-year period to about 24.4 billion bbl, according to a February report sponsored by the Ground Water Protection Council (GWPC). This also comes as the volume of oil, gas, and water produced in the US has increased.
Written by John Veil, president of Veil Environmental, the 137-page report titled “US Produced Water Volumes and Management Practices in 2017,” estimates the total volume of produced water generated by the nearly 1 million oil and gas wells in the US during calendar year 2017. It also provides a breakdown of most US states and how that water was managed.
The report, which is the third done using similar methodology covering a 10-year period (2007, 2012, and 2017), focuses solely on produced water volumes and the types of water management practices that are used. It does not look at source water, the types of treatment used, storage practices, or transportation practices.
Produced water is water from the same formations as oil and gas. When oil and gas flow to the surface, the produced water is brought to the surface with the hydrocarbons. It may also originate as natural water in the formations or can be water that was previously injected into those formations through activities designed to increase oil production, such as waterflooding or steamflooding operations.
What’s important about this, said Veil, is that there may be opportunities to put produced water to some other use, thereby conserving freshwater resources for drinking, agriculture, and domestic use.
“A great deal of produced water is being reused within the oil and gas industry to make up new drilling fluids, in hydraulic fracturing operations, and in waterfloods conducted to bring more oil out of formations,” said Veil. “Opportunities to use produced water in applications outside the oil and gas industry are not as readily available but may make sense in certain circumstances.”
Second, produced water is a byproduct of oil and gas production, he said, noting that as long as companies produce oil and gas, the need to figure out ways to manage the water in an environmentally responsible way at an affordable cost will be vital.
Data Collection and Approach
“Very little has changed concerning background and characteristics of produced water,” Veil said in the report. “The methods used to collect data are the same as were used in the previous study. The availability and quality of the data collected for 2017 was variable—very much like the data from the previous study.”
The data in the report were collected by contacting state oil and gas agencies in 35 states believed to have active oil and gas production in 2017 and several federal agencies that have jurisdiction over federal onshore and offshore lands and tribal lands to obtain detailed information on produced water volumes and management. Veil noted that not all states had readily available precise produced water volume figures. In a few states, the agencies had very complete data records easily obtainable from online sources.
Other states had summary-level volume data without much detail or had data available only in in-house data repositories. Where complete data were not available, it was necessary to estimate volumes using assumptions, alternate data, calculations, and extrapolations.
Key Findings
The important takeaway message from the data collected, according to Veil, is that water production increased at a slower rate than oil and gas production.
“This means that for every bbl of oil and MMcf (million cubic feet) of gas produced in 2017, less produced water was generated than in 2007 and 2012.”
In 2017, onshore oil and gas wells generated 23.8 billion bbl of produced water. Offshore oil and gas wells contributed another 576 million bbl for a total US volume of nearly 24.4 billion bbl of produced water in 2017.
For the interval of 2012 to 2017, US oil production increased by 50.4%, and US gas production increased by 17.7% during those years. US water production increased by 15.2% between 2012 and 2017.
Looking at the entire 10-year period from 2007 to 2017, the numbers are even more extreme. US oil production increased by 94.6%, and US gas production increased by 43.6% during those years alongside the 16.2% increase in US water production over the same period.
Veil said one explanation as to why oil and gas volumes have increased at a faster rate than water volumes involves the types of wells and formations that are used to produce hydrocarbon.
“In 2007, much of the US production came from wells in conventional formations,” he stated “Wells in conventional formations tend to generate a small initial volume of water that gradually increases over time. The total lifetime water production from each well can be high.”
Also, between 2007 and 2012, the US experienced a large increase in the numbers of wells drilled in unconventional formations such as shales and coal seams. These wells generate a relatively large amount of produced water initially (the flowback period) but the volume drops off, leading to a low lifetime water production from each well.
As many new unconventional wells were placed into service, many older conventional wells (with high water cuts) were taken out of service. The new wells generated more hydrocarbon for each unit of water than the older wells they replaced.
Texas Leads the Way
Several states dominated the 2017 total produced water volume estimates, but Texas exceeded all others.
Texas, with nearly 10 billion bbl, represented 41% of the national total. Other states with produced water volumes exceeding 1 billion bbl included California (13%), Oklahoma (12%), Wyoming (7%), and Kansas (5%).
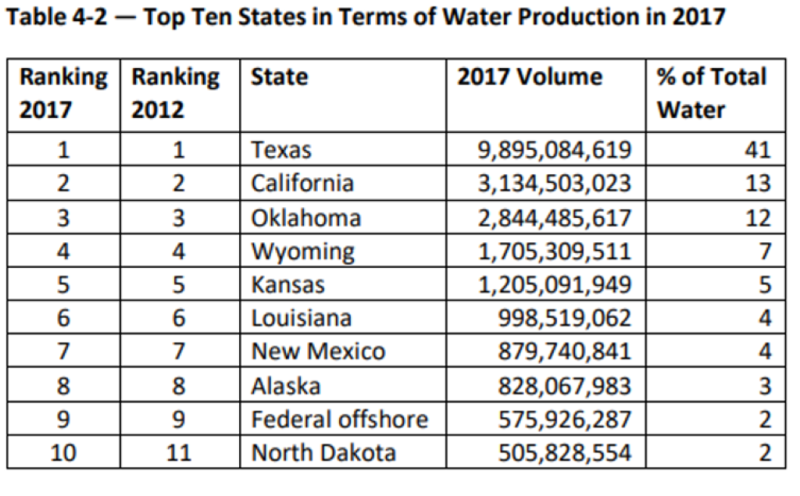
Texas also produced the highest volumes of oil and gas. But the other top water-producing states were not necessarily in the highest rankings for oil and gas production.
Produced Water Management Practices
Veil’s report said nearly all produced water is managed in one of the following ways:
• Injection to a hydrocarbon-bearing formation to help produce more hydrocarbon (enhanced recovery) • Injection to a nonhydrocarbon-bearing formation for disposal
• Discharge to surface water bodies
• Evaporation
• Paying a commercial disposal company to take the water and manage it
• Reuse for oil and gas operations (e.g., drilling fluids, frac fluids)
• Reuse for other purposes.
Veil added that some states track produced water management closely, but most states do not have much information on how the water is handled and managed other than injection volumes.
The table below shows a breakdown of the management practices for 2017.
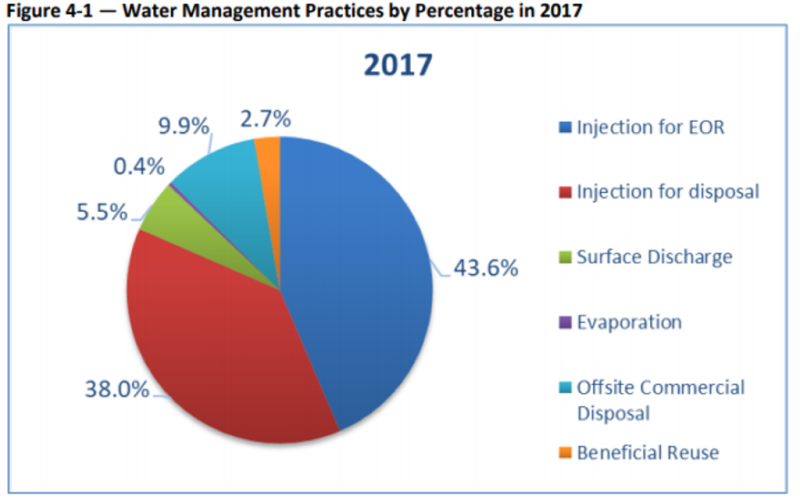
Veil pointed out that the percentage of water injected has remained over 90% during the 10-year period and is very similar between 2012 and 2017.
Among his final conclusions to the report, Veil said, as he did in his previous two studies, there is no easy way to obtain national estimates of produced water generation and management. Some states had produced water information either published in reports or readily available through state databases. However, other states had only minimal information about produced water volumes or how the produced water was managed.
More importantly Veil said no federal data collection effort exists for tracking produced water volume and consequently, when regulatory and data management resources are limited, some states do not maintain produced water information.