

While increasing coiled-tubing (CT) diameter remains a theoretical option to improve reach, doing so creates logistical challenges. Although fluid-hammer tools and downhole tractors have extended the reasonable operational range of CT significantly, they also increase circulating pressures and operational complexity. To reach a 10,000-ft lateral, the use of metal-on-metal lubricants will be required to work in conjunction with the other systems. Arising from a series of trials is a new lubricant that reduced the linear coefficient of friction (CoF) by approximately 40 to 60% (0.10 to 0.14) under downhole conditions.
Introduction
In this study, the results of an extensive set of laboratory linear-friction measurements aimed at mimicking downhole conditions are reported. Temperature was the factor identified to most influence linear CoF. As far as the authors of the complete paper are aware, the relationship between temperature and CoF has never been investigated before for CT operations, either experimentally or theoretically. Several in-house laboratory rotational-friction tests were performed in the past for understanding the wet-dynamic-friction mechanisms for CT operations. CoF values as low as 0.05 were obtained. Similar low values were also reported by other investigators. However, none of these CoF values has been confirmed in the field (typical field values are closer to the generic CoF value of 0.24 than to the aforementioned laboratory values).
Lubricants are used in CT operations for two primary reasons. The first is the prejob planned use of lubricant either to reach farther in a lateral or to reduce pulling weights. The second, and by far the most common, application for lubricants is to reduce the contact friction to reach slightly farther in the well or to release tubing or tools stuck in hole. These situations, termed operational recovery, typically use small slugs of lubricant to reduce frictional drag locally.
In both cases, engineers are frequently asked to quantify the benefits of using the lubricant. This is achieved by post-job matching of the observed weights to computer-model predictions. This task is significantly easier and far more accurate when used in the planned phase. In these situations, a greater section of the well is lubricated and steady-state weight records are available over a longer lateral section. Additionally, there is often the chance to match the base-case unlubricated results. A quantitative lubricant benefit can be derived when this level of data is available. In operational-recovery situations, there are typically multiple changes occurring over a short period of time, making an accurate derivation of friction changes very challenging.
Operational Case Histories Using Lubricants
The complete paper includes three case histories covering CT operations in a variety of situations. Three lubricants, denoted as Lubricants 1, 2, and 3, were used. All three case histories were planned in such a way that sufficient lubricant was used to cover the deviated section of the wellbore fully. The first two cases present CoF reduction of 33 and 39%, respectively. The third case, with Lubricant 3, did not yield any change of friction from the base case. In the first two cases, the CoF reduction is significantly greater than the usual 15 to 20% observed when lubricants are used for operational-recovery situations.
Post-job CoF in each case history was determined by use of the following method:
- Running-in-hole (RIH) and pulling-out-of-hole (POOH) weights were extracted while ensuring that they were from similar well conditions.
- The computer model was updated with the actual circulating- and producing-fluid/gas rates and pressures.
- The surface-equipment factors that affect predicted and actual observed weights were adjusted (stripper drag, reel-back tension, and goose-neck misalignment).
- The CoF was modified to create the best curve fit of predicted weight to actual weight.
Unless some significant change in well condition occurs, the CoF should be the same value for both RIH and POOH conditions. The most common changes would be the introduction of lubricant before POOH or changes in the amount of solid debris present in the wellbore. Variable factors such as composite-plug or other debris at the bottomhole assembly (BHA) would be modeled best as a tensile or compressive change at the BHA.
Linear-Friction Laboratory Measurements
The most important factors included in the laboratory-testing procedure for this study are temperature, fluid type and composition, and contact-surface type and roughness.
The linear-friction tester is shown in Fig. 1 above. It can measure wet dynamic friction at a constant speed of 150 mm/min (6 in./min). Although this is considerably lower than typical CT speeds, additional testing with all the lubricants discussed in a preceding section of the complete paper shows that the CT speed does not have a strong effect on friction.
The friction instrument features a heating pad below the metal plate (planar or tubular) on which the CT coupon is sliding. The tests reported here used three thermocouples: two above the metal plate at each end and one below the metal plate (on the heating pad) for temperature measurement and control. Although the heating pad is rated at 300°C, the maximum temperature at which measurements could be performed was 70°C because the fluids started to evaporate at approximately 74°C. All laboratory results reported here were from tests performed at room temperature (approximately 20°C), pressure, and humidity.
The instrument is directly connected to a computer and has its own software that allows real-time data acquisition and visualization of the friction force or CoF. Minimum, maximum, and average CoF values were recorded for each measurement. Each measurement was repeated 10 times, and standard deviations (SDs) were calculated. For the results reported here, all SDs were lower than 0.03, inspiring confidence in the repeatability and reliability of the laboratory results.
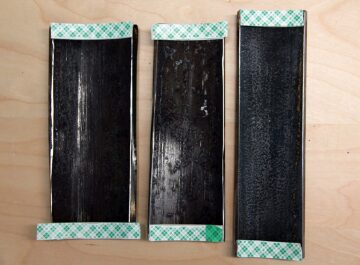
Several CT coupons were used. Three tubular samples, shown in Fig. 2, and two planar plates were also used. Two tubular samples are Cr-13, with average roughness of 5.68 and 11.83 µm, respectively, and the third one is P-110, with an average roughness of 12.44 µm. The two planar plates have an average roughness of 0.67 and 9.85 µm, respectively. All samples were new when first tested.
For a discussion of linear-friction laboratory results for different lubricants, including the proposed lubricant (referred to in the complete paper as the New Lubricant), please see the complete paper.
Other Tests
A temperature test for the effect of the synergy between the proposed lubricant and friction reducers and a temperature test for the effect on aging solutions of 1% proposed lubricant mixed in seawater were also performed. A regained-permeability test revealed that the proposed lubricant does not damage the formation, with or without friction reducers.
The temperature-dependent CoFs were tested for 1% proposed lubricant mixed in seawater with three friction reducers currently used in CT operations. Although at 20°C the linear CoFs were similar for all three solutions, they diverge at higher temperatures. For instance, at 70°C, the linear CoF obtained for the FR1 solution (0.11) was 15 and 21% lower, respectively, than those for the FR2 and FR3 solutions (0.13 and 0.14, respectively). These results show that the chemical synergy between the proposed lubricant and the friction reducers used in the field can affect the downhole lubricity. Before using any friction reducer in the field, laboratory tests should be performed to determine the expected lubricity effects.
The temperature-dependent CoFs were also tested for three solutions of 1% proposed lubricant mixed in seawater. The three tests were performed 30 minutes, 5 days, and 30 days, respectively, after the solutions were mixed. Because all three solutions had very similar CoFs, it can be concluded that the proposed lubricant is stable from the standpoint of lubricity when mixed in seawater. This test was necessary to demonstrate that the lubricity properties of the proposed lubricant are not altered if it is prepared in the laboratory and shipped to the field.
Case History 1 for Proposed Lubricant
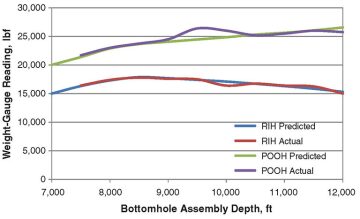
This operation was conducted in a 5½‑in. J-shaped monobore well in the Permian basin. The lateral was approximately 3,500 ft in length, with the majority of the inclination in the 88 to 92° range. The operation was to perform an annular fracture treatment, with diversion achieved with a CT-deployed packer. Previously conducted preparation runs in this well without the use of a lubricant revealed a CoF of 0.24, as illustrated in Fig. 3. When running the CT with a deployment packer for the fracture treatment, the proposed lubricant was introduced at a concentration of 1% with a pump rate of 1.2 bbl/min while RIH at 60 ft/min. This ensured that the new lubricant was distributed uniformly in the lateral. Additional friction reducer FR1 was added at 0.1 gal/1,000 gal. Both lubricant and friction reducer were circulated by constant-rate chemical-additive pumps to remove any human errors during mixing. Note that in Fig. 3, excess drag was present between 9,000 and 10,000 ft owing to wellbore debris on POOH (the deviation between the actual and predicted weights during POOH). To allow post-job calculations of the CoFs for RIH and POOH, additional pull tests were performed every 500 ft. Post-job force matching revealed a CoF in the lateral of 0.13, a friction reduction of 46% when no lubricant was used. Similar CoF values (i.e., 0.10 to 0.14) were obtained in our laboratory tests with the same lubricant concentration at temperatures of 70°C.
Case History 2 for Proposed Lubricant
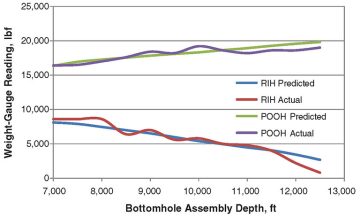
This operation was also conducted in a 5½-in. J-shaped monobore well in the Permian basin. The lateral was approximately 5,100 ft in length, with the majority of the inclination in the 89 to 93° range. This operation was also conducted to perform an annular fracture treatment, with diversion achieved with a CT-deployed packer. Previously conducted preparation runs in this well with the use of an extended-reach fluid-hammer tool revealed a CoF of 0.22 with 1,000-lbf tensile benefit (Fig. 4). The slightly lower-than-expected CoF (i.e., 0.22 vs. 0.24 in the previous operation) was attributed to the vibrations of the fluid-hammer tool. When running the CT with a deployment packer for the fracture treatment, the proposed lubricant was introduced at a concentration of 1% with a pump rate of 0.75 bbl/min while RIH at 45 ft/min. This ensured that the new lubricant was distributed uniformly in the lateral. Additional friction reducer FR1 was added at 0.1 gal/1,000 gal. Both lubricant and friction reducer were circulated by constant-rate chemical-additive pumps to remove any human errors during mixing. To allow post-job calculations of the CoFs for RIH and POOH, additional pull tests were performed every 500 ft. Again, post-job force matching revealed a CoF in the lateral of 0.13, a friction reduction of 41% when no lubricant was used. Similar CoF values were obtained in our laboratory tests with the same lubricant concentration at temperatures of 70°C.
For a discussion of the temperature-dependent friction model, please see the complete paper.
Conclusions
Laboratory data for wet dynamic friction mimicking the downhole conditions during CT operations were presented for the first time.
- Rotational-friction data were continually optimistic about CoF reductions when compared with post-job matched case histories.
- A new temperature-dependent CoF model is proposed that could be incorporated in CT software easily for more-accurate prediction of CT-job parameters in the planning stage.
- A new lubricant has been designed and tested to demonstrate increased CT lubricity by approximately 40 to 60% under downhole conditions compared with older CT lubricants.
- Two field trials of this new lubricant illustrate a close match of field and laboratory data (0.13 vs. 0.10 to 0.14, respectively).
This article, written by JPT Technology Editor Chris Carpenter, contains highlights of paper SPE 168298, “Increasing Lubricity of Downhole Fluids for Coiled-Tubing Operations,” by Silviu Livescu, SPE, and Steven Craig, SPE, Baker Hughes, prepared for the 2014 SPE/ICoTA Coiled Tubing and Well Intervention Conference and Exhibition, The Woodlands, Texas, USA, 25–26 March. The paper has not been peer reviewed.