

A rigorous modeling approach is developed for effective management and inventory analysis of natural-gas storage in underground salt caverns. Computational-fluid-dynamics and heat-transfer modeling approaches are implemented to simulate the strongly coupled fluid-mechanics and heat-transfer problems involving cavern gas storage. Accurate prediction of natural-gas storage performance and inventories made on the basis of the present comprehensive simulation approach can be instrumental in effective management and balancing of natural-gas supply and demand.
Introduction
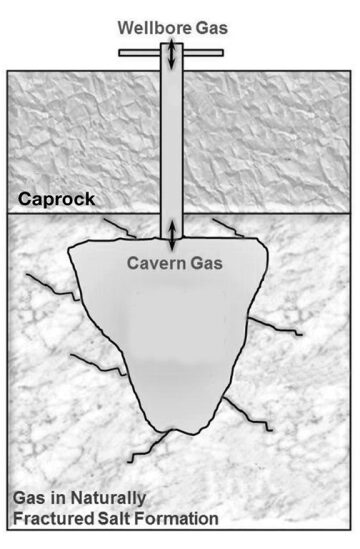
Gas-storage caverns are typically developed through drilling of a wellbore to reach the salt formation and subsequently injecting and circulating hot water to dissolve and remove the salt and create a cavity intended for gas storage by a process known as solution mining. Gas-storage-cavern facilities consist of three subsystems: the wellbore that connects surface facilities with the cavern, the cavern itself, and the surrounding salt formation enclosing the cavern (Fig. 1). Accurate prediction of cavern-gas pressure is important for avoiding improper gas-storage-operation parameters and thus the fracturing and failure of the salt formation (and hence cavern-roof collapse, which can lead to catastrophic incidents where the stored gas migrates toward the ground surface and causes harm to field personnel and the nearby population or damage to surface facilities). On the other hand, loss of volume caused by creep closure can occur when the cavern-gas pressure drops below the minimum allowable cavern pressure. Effective management and inventory analyses of underground natural-gas storage are generally accomplished by modeling and simulation of the gas conditions in the storage media.
The increasing popularity of salt caverns is attributed to their flexibility to switch quickly from gas injection to gas production. The void space of the cavern does not cause pressure loss from flow restrictions in contrast to depleted reservoirs or aquifers. Ideally, stored gas cannot leak into the surrounding naturally fractured salt formation because of the essentially negligible porosity and permeability of the formation. Thickness of salt formations can vary typically from a few meters in salt beds to thousands of meters in salt domes.
The present modeling approach is carried out for prediction of the cavern-gas-operation conditions (pressures and temperatures), and quantification of the volume of gas present in the cavern at any time to monitor assets and losses through inventory analysis. Inventory is the volume of gas present in the cavern at any point in time and is composed of the working- and cushion-gas portions of the stored gas. This volume of gas depends on the prevailing pressure and temperature and the type and size of the cavern. The modeling approach is developed for accurate natural-gas storage and inventory analysis and management in underground salt caverns.
The accuracy of this simulator is established by comparing the results of the present simulations with those obtained under various simplified conditions in previous studies (for a critical review of these modeling approaches, please see the complete paper). Typical scenarios of gas-storage simulations are presented here for realistic cases of practical importance. The results indicate that the gas pressure increases in the cavern significantly during the injection phase; slightly decreases during storage, essentially because of gas leakoff and cooling effects; and decreases during production. Cavern shapes such as inverted cones and spheres resulted in lower operating gas pressures than did cylindrical shapes, and therefore more gas can be stored safely in these before reaching the maximum allowable cavern pressure. An investigation of the effect of cavern shape on gas-storage modeling and inventory analysis demonstrated that not only can temperature, pressure, and total volume affect cavern-gas inventories, but so can cavern shape.
Physical Model
Fig. 1 is a schematic of the physical model considered in this study for simulation of the three subsystems involved in gas-storage-cavern operations. The considerations of the mass, momentum, and energy balance in the wellbore are a transient-state process, and the heat exchange with the surroundings is considered. The large gas cavern includes the transient-pressure and -temperature spatial distributions. The best of the previously available models considers less than 50% of the factors involved in a real gas-storage process. In addition, the best previously available model is applicable only for a cylindrical shape cavern, whereas the shapes resulting from solution mining are usually not cylindrical.
For the first part of the present modeling applications, a geometrical system is constructed that resembles the physical model of the three cavern subsystems. The physical dimensions of the cavern and the salt formation were defined considering the American Petroleum Institute recommended practice for the minimum distance between two neighboring caverns.
Suitable numerical-gridding distribution is assigned for the cavern-geometry system by use of software that can create both structured and unstructured grids for orthogonal and nonorthogonal geometries that could not be considered in the previous modeling approaches. The boundary conditions are defined in the software. The grid system is exported into flow-modeling-simulation software where the boundary and initial conditions are provided as input. The numerical solution method is selected, and the initial conditions are set to initialize the simulation. The flow-modeling-simulation software solves the governing equations of mass, momentum, and energy applied over each control volume of the cavern system for each timestep using a finite-volume-difference method. The solution is finalized when the specified convergence criteria are reached after each timestep. As a further revision of the accuracy of results, a grid-sensitivity analysis with different grid sizes is carried out to ensure that the simulation results are independent of grid sizes. Ultimately, the numerical and graphical results of the three subsystems are processed properly to describe gas-storage dynamics during injection, storage, and production, and to perform a cavern-inventory analysis. The computational time of the simulations greatly depends on the geometry of the cavern, the type of gridding system, the required accuracy of the simulation, and the computer hardware used. For instance, a cylindrical cavern model composed of an orthogonal (structured) gridding system with 324 control volumes has a ratio of real time to computational time of approximately 8 hours to 1 hour, whereas a cavern system with the shape of an inverted cone and using an unstructured gridding system with 5,576 control volumes has a ratio of approximately 2:1.
Coupling of Thermohydraulics of Wellbore, Cavern, and Salt Formations. Modeling the injection, storage, and production of natural gas in underground salt caverns requires the energy-, momentum-, and mass-conservation equations to be solved simultaneously. For a review of these equations, as well as a discussion of model considerations and the conditions of simulations, please see the complete paper.
Simulation Results. The data obtained from the simulations are analyzed and graphed properly for the injection/storage/production cycle of a cavern of prescribed shape (inverted-cone shape) for the purpose of demonstrating the capabilities of this modeling approach. The effect of the cavern shape on gas-cavern pressure and temperature is demonstrated by simulating cylindrical and spherical caverns. In addition, an irregularly shaped cavern-gas modeling is introduced and the pressure and temperature values compared with those of the corresponding regular shape of equal volume. The pressure and temperature along the wellbore increase from the wellhead as the gas travels along the wellbore closer to the salt cavity. The pressure differential between the wellhead and the top of the cavern is approximately 1200 kPa. It is noted that cavern-gas pressure varies with location in the cavern. The highest gas pressure is found at the bottom of the cavern. The radial gas-pressure gradient is negligible. This information is important in avoiding exceeding the maximum allowable working pressure of the formation. The temperature distribution inside the cavern is almost uniform.
In general, for all the shapes, the cavern pressure increases during the injection period and decreases during the production period. This is attributed to the changes in mass of the gas in the cavern. The mass of gas in the cavern increases for injection and decreases as gas is being removed from the cavern during the production period. The cavern pressure slightly drops immediately after the wellbore is shut in at the beginning of the storage period and maintains approximately the same pressure while the gas is being stored over a period of time. The pressure drops during production. The results for average pressure and temperature are comparable with those presented in previous studies.
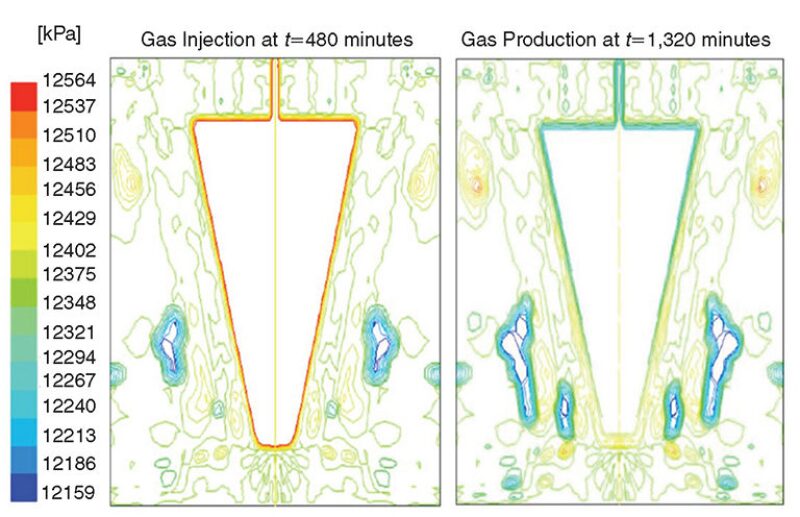
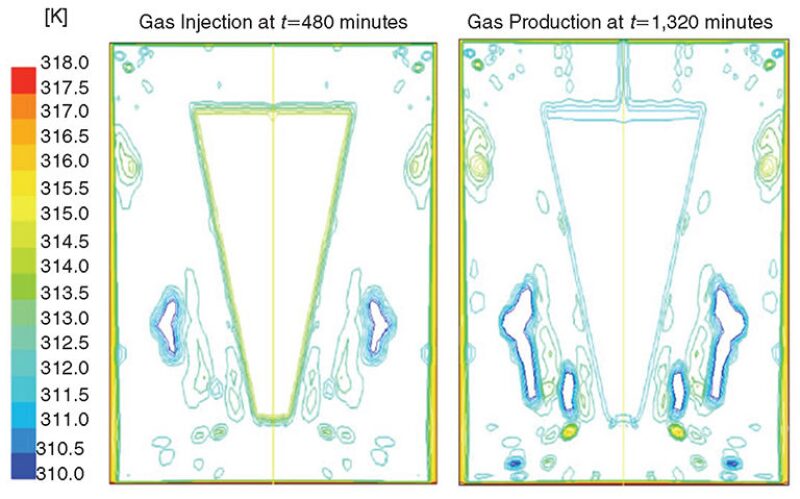
Fig. 2 presents the pressure distribution of gas in the naturally fractured salt formation at a time of 480 minutes at the end of the injection period and at a time of 1,320 minutes, which corresponds to 360 minutes after the start of gas production. The pressure of the far formation at the instant of injection is lower than the pressure in the vicinity of the cavern. In contrast, the pressure of the far formation at the instant of production is higher than the pressure in the vicinity of the cavern. The change in formation pressure does not vary significantly when switching from gas injection to production. Fig. 3 presents temperature distribution at a time of 480 minutes at the end of the of the injection period and at a time of 1,320 minutes, which corresponds to 360 minutes after the start of gas production. Gas cooling at the instant of production has a greater effect on the temperature of the far formation than on the pressure in the vicinity of the cavern.
Gas leakage into the formation occurs because of the pressure differential existing between the salt formation and cavern gas. Gas leaks into the formation when the cavern pressure exceeds the salt-formation pressure. Conversely, gas leaks back into the cavern when cavern pressure is lower than the salt-formation pressure. However, the salt-formation pressure does not vary significantly during the mass-exchange process with the cavern. This can be attributed to the fact that the amount of gas leakage is small, because the apparent permeability of the salt formation is very low.
Gas Inventory. The sum of the working gas and the cushion gas present in the storage cavern at any point in time is referred to as the gas inventory. This volume of gas is dependent on the pressure, cavern type, and size of the cavern. Gas inventories are presented by hysteresis plots, in which the average bottomhole pseudopressure is plotted against inventory in units of standard volume.
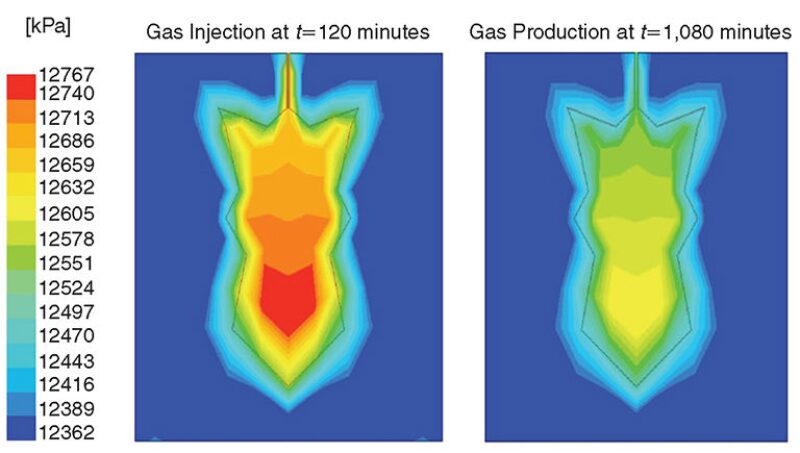
This modeling approach can also help practicing engineers perform gas-injection, -storage, and -production simulations and inventory analysis for irregularly shaped caverns for which the actual shape and size can be determined with sonar or other appropriate logging tools. Fig. 4 presents the cavern pressure distribution at different times during gas injection and production for an irregular-cavern-shape configuration. The highest pressure is found at the bottom of the cavern. The pressure in the cavern increases with the time of injection. Irregularly shaped caverns follow the same trend as those with regular shapes. In general, the cavern pressure increases during the injection period and decreases during the productio period.
Ensuring that regular and irregular cavern shapes do not differ significantly in gas-storage performance can result in fewer time-consuming simulations because the simulations of regularly shaped caverns would be faster if they could sufficiently approximate real cavern shapes.
This article, written by JPT Technology Editor Chris Carpenter, contains highlights of paper SPE 164489, “Modeling and Analysis of Salt-Cavern Natural-Gas Storage,” by P. Barajas and F. Civan, SPE, University of Oklahoma, prepared for the 2013 SPE Production and Operations Symposium, Oklahoma City, Oklahoma, USA, 23–26 March. The paper has been peer reviewed and published in the February 2014 SPE Production & Operations journal.