
Many deepwater wells experience steep productivity declines. On the basis of field observations, this decline is partly attributed to fines-migration effects. The complete paper presents a numerical work flow to simulate the effect of flow-induced fines migration on production decline over time in deepwater reservoirs. This work flow will help reservoir engineers to predict the damage caused by fines migration, predict production decline, and plan remediation.
Introduction
Although there are generally two causes of fines mobilization (or release), chemical (colloidal) and mechanical (hydrodynamical or flow), the complete paper focuses only on the mechanically induced fines migration, in which fines are mobilized by increasing flow velocity. As with chemically induced fines, there is a critical flow velocity at which fines are mobilized.
Previous studies focused on characterizing fines-migration processes by use of intricate mathematical models and adjustment of modeling parameters to match laboratory results. These models are mathematically complex and computationally expensive usually, which means they are applicable only to 1D simulation. To solve engineering problems, reservoir engineers need to perform realistic simulation on complex 3D geometries.
Method
Fit to Laboratory Test Results. A fines-migration test includes coreflooding at several different rates. The rates are kept constant while pressure is allowed to change. Rate and pressures are recorded during the test. By use of this information and core dimensions and fluid properties, the permeability can be calculated with Darcy’s law. The total test time for the “standard” or conventional fines-migration test normally is 1 week. A recent study on fines migration determined that short-term (1-week) fines-migration tests were not long enough to observe fines migration in the laboratory; hence, the study recommended an extended-fines-migration (EFM) test as the new testing standard.
The EFM test normally runs for 3 weeks instead of 1 week. The longer time allows the permeability loss caused by the fines-migration damage to be separated from that caused by other factors. Also, a low-flow-rate step is introduced after reaching the highest designed rate to determine if the observed damage is caused by fines migration or by turbulent flow (non-Darcy flow). Fines migration occurs only when the flow velocity is greater than the critical velocity. The authors usually observed severe damage only at high flow velocity in the testing process. However, at high flow velocity, non-Darcy flow also takes place, thereby contributing to the permeability reduction. Therefore, it is important to add a step at a low velocity after the highest designed rate to determine the actual damage caused by fines migration.
The model assumes single-phase flow. After observing the EFM experiments, the permeability damage caused by fines migration is derived as an exponential function (this process is discussed in the complete paper).
The amount of damage is a function of the pore-volume throughput. There are two parameters that characterize the permeability-reduction function: permeability-reduction rate and residual permeability. The permeability-reduction rate controls the speed of fines-migration damage. With higher permeability-reduction rate, the damages occur faster. Another important parameter is the residual permeability, which is the final value that the permeability approaches asymptotically.
A fines-migration module is implemented into an in-house reservoir-geomechanics simulator to enable computing of the fluid velocity and pore-volume throughput for each cell. This step allows permeability reduction caused by fines migration to be represented explicitly in the model. The permeability-reduction function is used as an input to the simulator. Theoretically, any permeability-reduction formula can be used. In addition to the permeability-reduction function, the critical (interstitial) velocity needs to be defined.
During the simulation, the velocity value and direction of each cell is tracked. When the velocity magnitude is greater than the user-specified critical velocity, the fines-migration module is turned on. The amount of fluid flowing through each cell is tracked, starting from the timestep when the critical velocity is reached. Then, the fluid volume is converted to pore-volume throughput by dividing the volume by the porosity of that specific cell. The permeability of that cell declines as a function of the pore-volume throughput per the permeability-reduction function from the laboratory test. If, afterward, the flow direction is reversed in the cell, the permeability will be recovered to the initial permeability.
Model Description
A detailed model is constructed to study the effect of fines migration. The model includes an explicit representation of perforations, casing, cement, and a fracture, along with the damaged zones around each of these. Each component can be turned on/off to study fines-migration-damage effects.
Flow velocity is highest around the perforations, the fracture, and the reservoir matrix close to the wellbore. Hence, these are the places most likely to have fines-migration damage. By use of a detailed model with explicit perforations and fractures, it can be ensured that the fines-migration detail is captured. To ensure simulation speed, the vertical thickness of the formation is limited to 5 ft so that the simulation runs can be finished in a reasonably short time.
Results and Applications
From the simulation results, several important parameters can be determined that will provide practical evidence for reservoir management. For example, the optimal drawdown to maintain relatively high productivity index (PI) can be determined. Likewise, damage radius with time can be used to determine acidizing frequency and volume.
Prediction of Production Decline Caused by Fines Migration. The primary goal of having the fines-migration simulation model is to predict production performance under different scenarios. The PI (production over drawdown) can also be calculated to provide drawdown guidance. Larger drawdown might cause larger damage; therefore, it might not increase production.
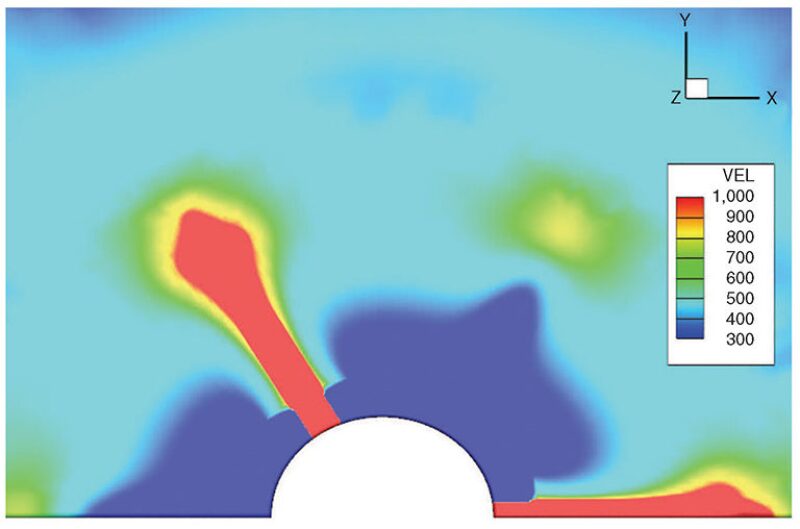
Study of the Flow Pattern Caused by Fines-Migration Damage. Fig. 1 above shows the scalar velocity magnitude of the flow around the wellbore. The highest velocity (red) is in the perforation tunnel. Interestingly, the velocity is not the highest in the reservoir rock closest to the wellbore. This is because of symmetry. The fluid in between the perforations will flow perpendicular to the closest perforation. But if the fluid is in the middle, it is effectively not flowing to either side because their pressure gradients cancel out. Even if the fluid molecule is not in the middle, the pressure gradient is reduced between the perforations, as indicated by the blue region. The perforation tip actually has a higher pressure gradient than the perforation root. Therefore, a higher velocity and a larger damage region occur at the perforation tip.
Once the velocity can be calculated explicitly, the fines-migration damage also can be calculated. As mentioned previously, the program tracks the flow velocity in each cell. If the velocity passes the critical velocity, the permeability multiplier begins acting on the cells. In considering the damage region calculated by the fines-migration model, much of the damage region correlates with the high-velocity regions shown in Fig. 1.
Three points were selected in the model to illustrate the detailed flow pattern caused by fines-migration damage: one point in the reservoir matrix (Point 3), one close to the perforation (Point 2), and the third in between (Point 1). The velocity at Point 2 exceeded critical velocity (500 ft/D); hence, the permeability was reduced immediately after flow started. The velocity at Point 3 never exceeded the critical velocity; therefore, the permeability stayed constant. Point 1 is interesting because the matrix permeability around the perforation tip reduced because of fines migration; the fluid had to flow around the perforation tip. The flow velocity began to exceed critical velocity after flow was diverted to the perforation root. Such a development can be visualized only in a 3D dynamic simulation.
Simulation of the evolution of the damage region caused by fines migration can be used to provide guidance concerning the optimal time for the next acid job to remove the fines-migration-damage zone.
Study of the Damage in Each Part of the Well. Perforation, fracture, and the damage zone around them can be treated separately in the simulation. They can be turned on or off individually to study the fines-migration-damage skin caused in each part. Although the perforation and fracture have the highest flow velocity, they might not experience the same fines-migration damage as the reservoir matrix. The perforation and fracture are filled with proppant, which are much larger and more sorted, resulting in relatively large permeabilities. The proppants also create larger pore throats, making them less likely to be plugged by fines particles.
It is concluded from the study that the fines-migration damage in the perforation tunnels does not affect production in a gravel-packed well significantly. In the frac-packed well, the opposite trend is observed: Fines migration in the fracture causes most of the drop in production, especially when the fractures are long. Treatment of the proppant pack in the fracture with fines-stabilizing agents might be beneficial in frac-packed wells but could potentially have limited effect in gravel-packed wells.
Conclusions
- Fines migration is expected to stabilize at a certain point in time. The time to stabilization is governed by the fines-migration-damage function, the drawdown, and the well configuration.
- The simulation shows that a limited damage radius of different shape, dependent on the well configuration, develops around the wellbore.
- For gravel-packed wells, the fines-migration damage incurred in the perforations does not alter the production profile significantly.
- For frac-packed wells, fines-migration damage incurred in the fracture governs the production profile, especially when the fractures are long.
This article, written by JPT Technology Editor Chris Carpenter, contains highlights of paper SPE 187263, “Modeling of Production Decline Caused by Fines Migration in Deepwater Reservoirs,” by Yunhui Tan, Yan Li, Ruiting Wu, Peggy Rijken, Karim Zaki, Oya Karazincir, Wade Williams, and Bin Wang, Chevron, prepared for the 2017 SPE Annual Technical Conference and Exhibition, San Antonio, Texas, USA, 9–11 October. The paper has not been peer reviewed.