

Energy efficiency is a top priority for the oil and gas sector, where controlling operational costs and reducing environmental impact are crucial. Companies in this industry face significant challenges in predicting and managing their electricity consumption, especially since weather conditions can vary widely.
By optimizing energy use, these companies can lower costs and improve sustainability. The potential savings from improving energy efficiency in the oil and gas industry are enormous. The International Energy Agency estimates that enhancing energy efficiency could save the global industry up to $700 billion annually by 2040. Weather data plays a key role in this effort, as temperature, humidity, pressure, and wind speed all significantly affect energy use. By accurately predicting these factors, companies can better anticipate changes in electrical consumption and demand. However, making these predictions requires precise data and sophisticated algorithms capable of real-time processing. Ensuring the accuracy and reliability of this data is crucial because inaccuracies can lead to poor energy management decisions.
Despite efforts to enhance energy efficiency in the oil and gas industry, existing methods often lack real-time weather data integration. Studies on management efficiency and energy-saving strategies have provided insights but fall short of dynamically optimizing operations with climate data. Similarly, research on gas production and control systems focuses on technical aspects without addressing the need for real-time weather-based energy management. To address this gap, we propose a neural network model that leverages weather data to optimize electrical consumption, peak demand, and power factor in real time, enhancing operational efficiency and sustainability.
Related Work
Many studies have investigated energy efficiency and the use of climate data in the oil and gas industry with different methods and results. These studies, however, mainly focus on static improvements and policy analysis without incorporating real-time weather data for operational optimization. Other studies have suggested technical and organizational measures to enhance energy efficiency. These methods concentrate on internal processes and technologies, overlooking external climate variables that significantly affect energy consumption and demand.
Advanced technologies have shown potential in optimizing energy use. Machine learning applications in supply chain and logistics have been successful, though they mainly address logistics rather than direct energy consumption. Studies on model predictive control for building climate control demonstrate the benefits of using weather forecasts in energy management but are focused on building environments. The approach presented here specifically targets the oil and gas industry, using real-time weather data to predict and optimize electrical consumption, peak demand, and power factor dynamically.
Existing methods provide valuable insights but often do not integrate weather-driven predictions for real-time energy management. This work aims to fill these gaps by combining historical data analysis with real-time weather forecasting, tailored to the unique challenges and needs of the oil and gas sector.
Data Sources
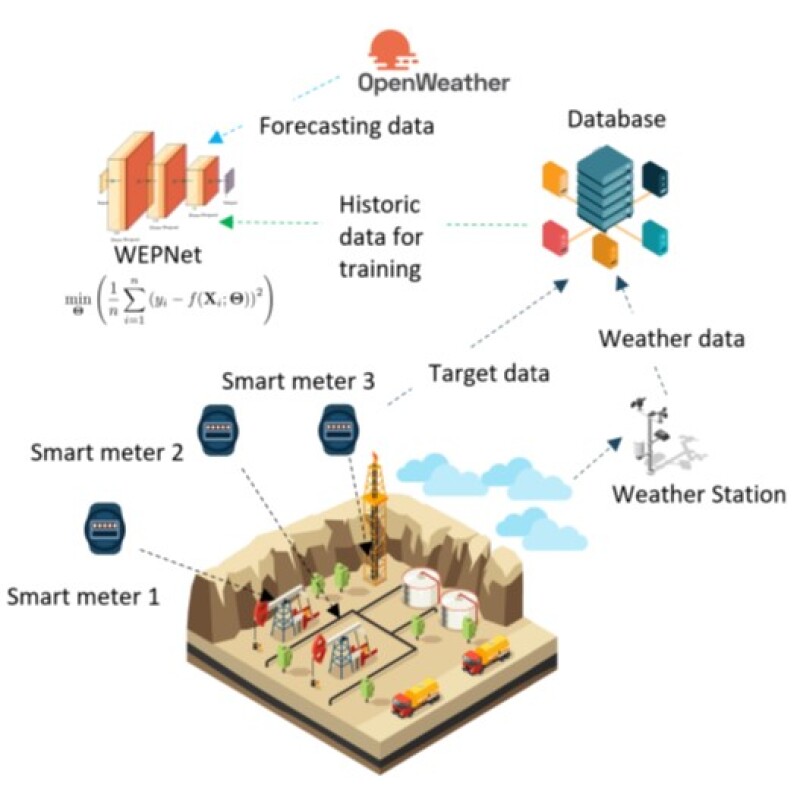
The system presented here uses a network of smart meters spread across multiple sites to collect crucial electrical data such as consumption, peak demand, and power factor. These meters send data to a central server, ensuring all information is collected and maintained accurately. Additionally, weather data is gathered from eight strategically placed weather stations, recording temperature, humidity, pressure, and wind speed hourly. The system also uses real-time data from the OpenWeatherMap application programming interface (API) to enhance the accuracy of predictions. Fig. 1 shows the integration of smart meters, weather stations, and real-time weather data from the OpenWeatherMap API into a central server for predictive modeling. The model processes historical and real-time data to forecast electrical consumption, peak demand, and power factor, enhancing operational efficiency and sustainability.
The data set consists of 12.1 million entries recorded hourly by 344 smart meters at the station named WEYBURN (Climate ID: 401HP5R), covering the period from 2019 to 2024. Features included in the model are Year, Month, Day, Hour, Station Pressure (kPa), Temperature (°C), Relative Humidity (%), and Wind Speed (km/h). Data preprocessing involved standardization of features using StandardScaler to ensure uniform scaling. Features were normalized using the StandardScaler to facilitate effective learning. The data set was split into training and testing sets, with 80% of the data used for training and 20% reserved for testing.
This setup ensures robust evaluation against unseen data. In developing the model, we focused on using historical weather and electrical data, excluding equipment-specific parameters. This is because the smart meters provide detailed recordings every 15 minutes, whereas equipment data typically have a lower temporal resolution and often suffer from missing entries. By concentrating on weather-related variables and their relationship with electrical usage, the model captures complex patterns and makes reliable forecasts without needing equipment-specific information.
Data preprocessing and model training form the core of the framework. Initially, the collected data undergoes preprocessing steps, including extracting temporal features, normalizing environmental variables, and addressing any data gaps. This processed data is then used to train the model, designed to correlate weather and temporal inputs with electrical usage patterns. Integrating real-time weather data allows the system to adjust its forecasts dynamically, maintaining high accuracy. This combination of real-time and historical data enables the system to provide reliable forecasts for electrical consumption, peak demand, and power factor.
Energy Forecasting Model
The system uses a trained neural network model to generate predictions for electrical consumption, peak demand, and power factor by using preprocessed real-time weather data. Key features such as Month, Day, Hour, and Temperature (°C) are used, with target variables being SUM CONSUMPTION, MAX PEAKDEMAND, and AVG POWERFACTOR. The neural network includes an input layer that matches the number of features, one to four hidden layers with 32 to 512 units using ReLU activation functions, and dropout layers with rates from 0.0 to 0.5 to prevent overfitting. The output layer consists of a single unit with linear activation for continuous values. The Adam optimizer is used with a learning rate adjusted from 10−4 to 10−2 and mean squared error (MSE) as the loss function. To ensure accuracy and reliability, the model is continuously evaluated with metrics like MSE, mean absolute error, and R-squared (R2). Normalization ensures all feature values are uniformly scaled and missing data is handled appropriately to maintain data integrity. The main objective of the predictive model is to forecast electrical metrics accurately using weather data.
This problem is formulated as a supervised learning regression task, aiming to minimize the prediction error for each target variable. The model’s parameters are optimized to reduce the MSE between the predicted and actual values. Real-time weather data from the OpenWeatherMap API is continuously fed into the model, allowing it to update forecasts dynamically and provide accurate and responsive energy predictions.
This forecasting mechanism supports an hourly forecast horizon up to 15 days in advance, enabling timely operational decisions.
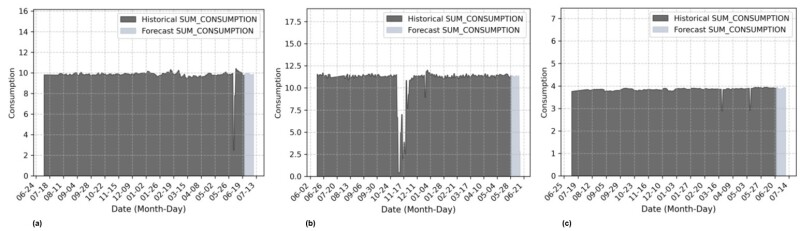
This model was validated through extensive testing using historical data and cross-validation to ensure robustness and reliability. Fig. 2 illustrates the comparison between historical and forecasted daily SUM CONSUMPTION for three distinct accounts. The graphs reveal that the forecasted values closely align with the historical data, demonstrating the model’s capability to accurately predict consumption trends. The model effectively handles varying consumption patterns, maintaining high accuracy across different accounts.
Analysis
Sensitivity analysis helps us understand how changes in weather variables affect electrical consumption, peak demand, and power factor. By using feature importance analysis, partial dependence plots, and correlation analysis, we can determine the most influential weather parameters. This understanding is essential for refining the model and applying it effectively in the oil and gas industry. The following sections detail each sensitivity analysis approach.
The feature importance plots in Fig. 3 provide an overview of how various input features contribute to predicting electrical consumption, peak demand, and power factor. From Fig. 3a, we see that Month is the most influential feature for predicting SUM CONSUMPTION, followed by Day. Other features, such as Temperature (°C), Station Pressure (kPa), Wind Speed (km/h), Relative Humidity (%), and Hour show progressively lower importance.
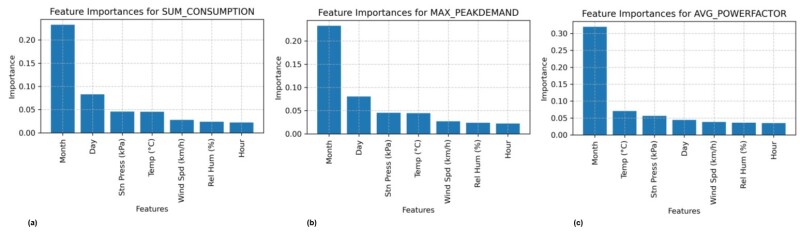
Similarly, Fig. 3b highlights that Month is critical for forecasting MAX PEAKDEMAND, with other weather-related features having a relatively minimal effect. In Fig. 3c, we see that Month also dominates in importance for predicting AVG POWERFACTOR, with Temperature (°C) being the most significant weather-related feature, albeit still less impactful than the temporal variables.
Partial dependence plots (PDPs) provide a comprehensive understanding of how each feature influences the target values of electrical consumption, peak demand, and power factor. From Table 1, the feature Month shows a moderate to significant effect, with partial dependence values for SUM CONSUMPTION fluctuating between 6.35 and 13.21, reflecting the seasonal trends in energy usage. This variability is also evident for MAX PEAKDEMAND and AVG POWERFACTOR, where Month exhibits peaks in July, signifying its relevance in capturing monthly variations in energy metrics.
The feature Day has a consistent yet moderate effect across all target values, indicating daily fluctuations that, while less pronounced, remain relevant for accurate energy forecasting. Temperature, a key weather variable, shows a gradual increase in partial dependence values, with peaks at 10.67 for SUM CONSUMPTION and 0.74 for both MAX PEAKDEMAND and AVG POWERFACTOR. This consistent impact across all target values underscores the crucial role of temperature in influencing energy consumption, peak demand, and power factor. Meanwhile, features such as pressure, humidity, and wind speed exhibit minor to moderate effects, with slight variations across the target metrics. These features, although less dominant than Temperature, still contribute to capturing the complexity of weather effects on energy usage. The sensitivity analysis using PDPs highlights Month, Day, and Temperature as the most influential features, justifying their prioritization in our model.
Feature | SUM CONSUMPTION | MAX PEAKDEMAND | AVG POWERFACTOR |
| Month | Moderate effect, | Variable effect, | Fluctuates, |
| Day | Consistent effect, | Moderate effect, | Minimal variation, |
Temperature (°C)
| Gradual increase, | Significant rise, | Noticeable effect, |
Pressure (kPa) | Slight influence, | Minor effect, | Moderate effect, |
Humidity (%) | Minimal effect, | Low influence, | Minor effect, |
Wind Speed (km/h) | Small effect, | Low influence, | Minimal effect, |
Table 1—Summary of PDP analysis.
The Pearson Correlation analysis provides a clear measure of the linear relationships between input features and target values, complementing our earlier sensitivity analyses. The correlation matrix reveals that "Month" has weak correlations with SUM_CONSUMPTION (-0.07), MAX_PEAKDEMAND (-0.07), and AVG_POWERFACTOR (-0.11). While these correlations are low, they may not fully capture the seasonal effects or interactions with other variables. Despite its weak direct influence, including "Month" in the analysis is important as it could interact with factors like temperature and humidity, or reflect non-linear seasonal trends. Additionally, treating "Month" as a categorical variable or creating interaction terms might reveal its role in seasonal variations. Temperature shows a slight positive correlation with SUM_CONSUMPTION (0.11), MAX_PEAKDEMAND (0.11), and AVG_POWERFACTOR (0.12), indicating a consistent but modest impact on energy metrics. Other features like relative humidity, wind speed, and station pressure have even weaker correlations. Notably, relative humidity shows a slight negative correlation with SUM_CONSUMPTION (-0.15), MAX_PEAKDEMAND (-0.15), and AVG_POWERFACTOR (-0.12), suggesting a minor inverse relationship.
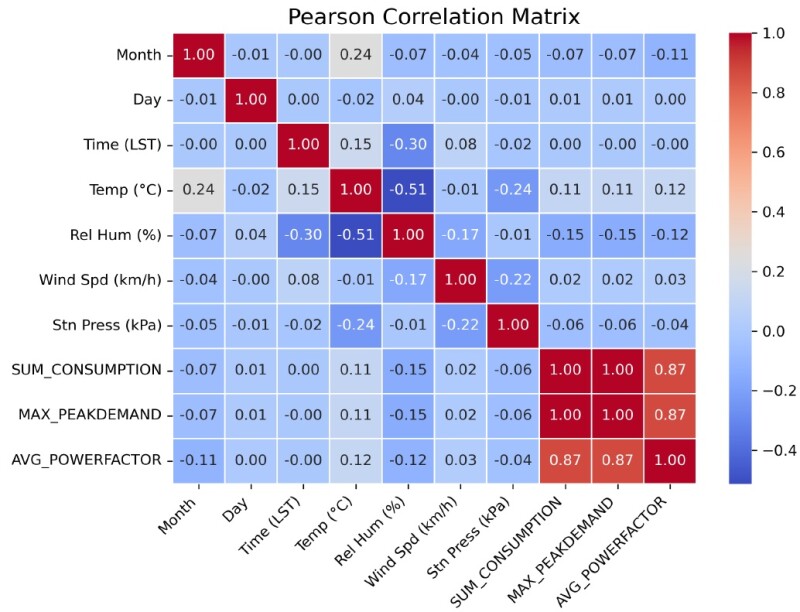
These values suggest that temporal features such as Month and Temperature are among the most influential factors in predicting energy consumption, peak demand, and power factor. The moderate to strong correlations of these features indicate their significant effect on the target values, justifying their inclusion in the model. While Relative Humidity shows a slight negative correlation, it does not demonstrate substantial importance compared with other features in previous analyses. Therefore, we focus on Month and Temperature as the primary features for the predictive model, ensuring that the model leverages the most relevant data for accurate and reliable energy forecasts.
Conclusion
This work tackled the challenge of predicting and managing electrical consumption and peak demand in the oil and gas industry to enhance energy efficiency and reduce operational costs. A neural network model was trained on historical weather and electrical data to forecast electrical consumption, peak demand, and power factor. Through sensitivity analysis, we identified Temperature, Month, and Day as the most significant predictors. This weather-driven forecasting was formulated as a regression problem aimed at minimizing MSE using deep neural networks. By integrating real-time temperature data from the OpenWeatherMap API, the model provided hourly forecasts up to 15 days in advance, offering valuable insights for short-term operational decision-making.
Implications for Industry
This research offers significant benefits for the oil and gas industry by improving the ability to predict and manage electrical consumption, peak demand, and power factor dynamically. Integrating real-time weather data into energy management systems allows companies to better anticipate and respond to fluctuations in energy usage, optimizing operational efficiency and reducing energy costs. Accurate forecasting of peak demand helps companies avoid excessive energy charges and improve grid stability. Additionally, forecasting power factor variations enables companies to implement corrective measures, minimizing losses from inefficient power usage. This proactive approach can lead to significant cost savings and a reduced environmental footprint.
Future Work
Future work will explore incorporating additional data sources, such as equipment-specific information, to enhance the accuracy of predictions. We aim to improve data acquisition techniques for more granular and continuous data capture, facilitating real-time forecasting and extended planning horizons. Enhancements in model architecture, including integrating advanced machine learning techniques and physics-based models, will be pursued to provide more comprehensive solutions for optimizing energy efficiency in the oil and gas industry.
