

A trip on Highway 285 between Fort Stockton, Texas, and Carlsbad, New Mexico, is both fascinating and horrifying for the average commuter in the US desert Southwest.
The 140-mile stretch of two-lane road can take hours to traverse on a given day as trucks hauling crude oil, sand, water, chemicals, and petroleum equipment overload the battered, sun-fried pavement. The mostly flat, dusty landscape is populated by drilling rigs, workover rigs, and gas flares as far as the eye can see. Even on the highway’s best day, most traffic laws are ignored as oilfield workers in pickup trucks race from site to site.
The industrial chaos along the corridor serves as a snapshot of the now multiyear industry boom in the Delaware Basin and greater, 75,000-sq-mile Permian Basin.
Keeping track of it all has become a massive challenge for operators, service firms, and midstream companies that make the basin move. They work in an environment that is changing daily, and they can’t afford to be caught by surprise when hydraulically fracturing a well, building infrastructure, delivering equipment to a remote area, or prospecting for new business.
An emerging solution: an intelligent, continually updated view from above—or satellite imagery analytics. Companies such as Sourcewater, Planet, and Westwood Global Energy Group are stepping up to monitor the world’s busiest oil play by leveraging relatively inexpensive satellite technology and machine learning.
Application of satellite imagery in the oil and gas industry is nothing new. It has been used by companies to monitor remote facilities. Market observers have used the technology to assess global oil supplies by tracking tanker traffic and storage levels. The World Bank has used it to estimate emissions from the flaring of natural gas and oil output by the Islamic State.
The real breakthrough is in merging this capability with advanced analytics to aid planning for development, production, and logistics while providing competitor intelligence and market research.
Development is still in the early stages as companies refine their models to produce the most reliable information possible, and products are just now being rolled out to clients.
Finding Water in the Desert
An early entrant in the satellite imagery analytics space, Sourcewater’s primary objective is to serve as an online data analytics platform and marketplace for oilfield water sourcing, recycling, and disposal.
Founded in 2014 as part of MIT’s Energy Ventures program, Sourcewater “is really about providing oilfield water market intelligence” to its clients, which often are operators planning their completions and production work and logistics or midstream water companies determining where to add new capacity, explained Josh Adler, Sourcewater chief executive officer.
Relatively new to the industry himself, Adler’s career path includes founding one of the Internet’s first matchmaking sites and serving as chief speechwriter to former US Treasury Secretary Paul O’Neill.
Sourcewater generates market analytics and forecasts by gathering data from multiple sources, including its own marketplace of buyers and sellers, government records databases, market research through hundreds of calls per day inquiring about water and disposal price and availability, and Internet of Things sensors and SCADA systems that bring in real-time data such as frac pit levels, disposal pressures, tank battery levels, and truck locations.
The company recently added satellite imagery analytics as one of those data sources. “We think there is a lot of predictive power and insight that can come from advancing satellite imagery analytics,” Adler said.
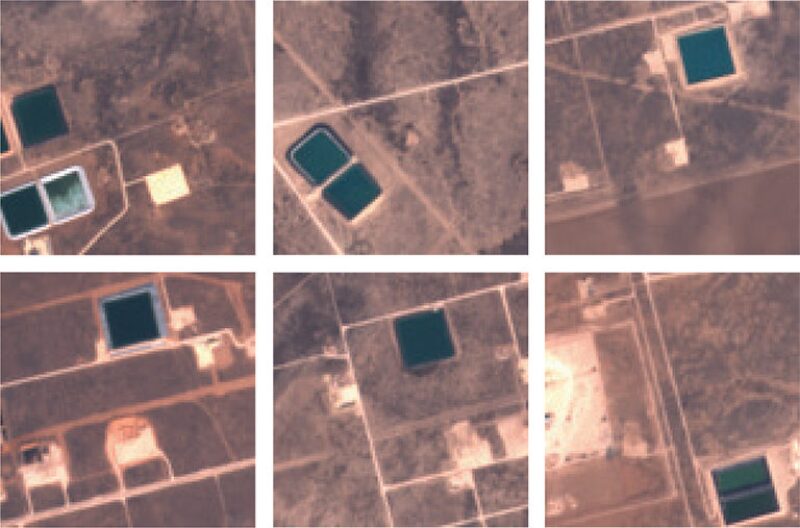
In most cases, constructing a frac pit in Texas does not require a permit, removing the possibility of referencing public data to account for available water. So the best way to canvass the landscape is from above.
Sourcewater analyzed 11 satellite images of the central Midland Basin that were taken almost quarterly from early 2016 to about mid-2018 and not always easy to gather. “Even in the desert of the Permian Basin you would be surprised how many days are cloudy,” Adler said. While spotting water in the desert on a clear day is not difficult, the challenge comes in identifying and measuring water pits vs. other water features.
The team developed a deep-learning model to process the images. It started by using object identification that considers size, shape, angles, visible and nonvisible electromagnetic spectra, and proximity to other relevant objects. “Frac pits tend be square and within a certain size range,” he said.
Pits were matched with external data to identify surface and mineral owners and the operators that control the leases. Sourcewater then called each identified surface owner and operator to confirm the amount and type of water in each pit, the pit’s capacity and recharge rate, the owner’s asking price for water, and price, volume, and buyer details for any recent transactions.
The model identified 8,298 frac pit instances over 3,600 sq. miles throughout the time series. The team was able to distinguish between freshwater pits and produced water pits based on certain characteristics of the spectral imagery of the water. The satellite images were examined alongside information on hydraulic fracturing activity obtained from IHS Markit based on FracFocus data on completions and water volumes injected.
“We saw that over the course of the 2½ years, the average pond [volume] grew steadily by 76%, which matches up with other information we have about typical fracs using more and more water per stimulation,” Adler said. “We also saw that the total pond volume available grew by nearly 250% from the trough of the market in mid-2016 through spring of 2018. That’s really a lot more water being pulled to the surface.”
While such growth might be expected with elevated fracturing activity along with higher injection volumes, Adler noted that “the intensity of the use of the lifted water available on the surface doubled during the first 18 months of the time period. In other words, even though water supply seemed to more than double in that time, the volume of water reported as injected for completions grew almost twice as fast as that growth in supply. That to me was a much more interesting beginning of an insight about what’s going on in the market.”
Best Predictor of New Drilling?
Pleased with its frac pit results, Sourcewater mulled where else it could apply satellite imagery analytics in the oil field. “That is when we started looking at well pad activity. Because before you can drill a well you have to clear a pad,” Adler said. Pads are typically cleared 1–4 months before a rig is moved on site—meaning satellite imagery analytics could predict drilling up to 4 months before a spud occurs.
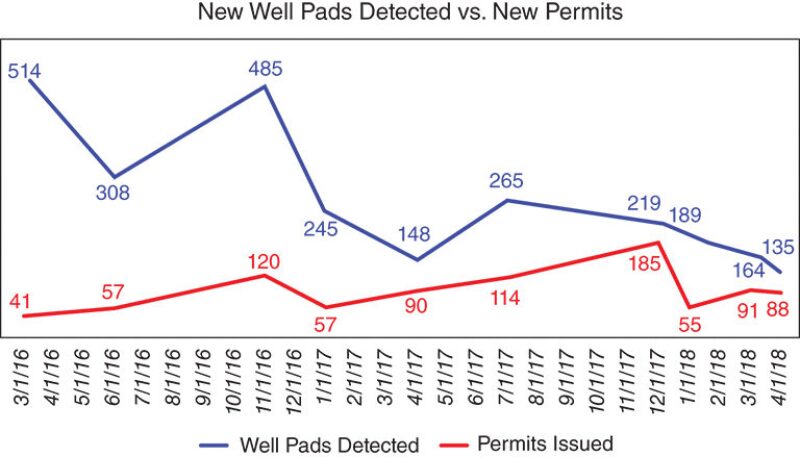
Before wells are drilled, operators have to file permits, which are publically available and widely used by the industry as the main predictor of new drilling. They are typically filed 1–2 months before a spud occurs and granted on the same day that they are submitted. Adler and his team found, however, that “looking at permits to predict where companies are going to drill is essentially useless.”
The team acquired a Howard County, Texas, dataset containing drilling permits and spud and well completion reports from 1987 through mid-2018. It then examined well pad activity from 2016 to mid-2018 using the same 11 image samples that were part of the frac pit study. “As we tuned the machine learning, we got a closer and closer fit in comparing well pads we were detecting from the imagery” with drilling permits filed with the Railroad Commission of Texas (RRC), he said.
The satellite’s first scan in January 2016 picked up 4,495 well pads and matched with RRC spud data dating back to 1987. Permit data showed 5,311 drilling permits were filed during that time period, which could mean up to 15% of permits either were not drilled or RRC form data were incorrect or lost. About 10% of spuds didn’t have a permit associated within 100 m, which also could have been from inaccurate data or lost records.
For the period between early 2016 and mid-2018, the pad images indicated there was a spud within 100 m of the pad almost 90% of the time, consistent with spud reports and permit data. “So we’re doing a good job of finding the pads that are out there using our machine-learning systems.
“What is not as good,” Adler said, “is our false positive rate. We are picking up features that are not well pads.” These objects, for example, can be harvested land on a farm, a road intersection, or a home or commercial construction site. Such stumbling blocks can be mitigated by applying additional layers of object identification to the machine-learning model, such as road maps, for example, because a well pad would not be in the middle of a state road.
Digging deeper into the more recent dataset, meanwhile, the team decided to match the API numbers of the drilling permits with completions reports. Much to its surprise, it found that, 25% of the time, a permit was filed after the well was already drilled—“sometimes months later,” he emphasized. On average, a drilling permit was filed 16 days after the well was spudded. Five percent of the time there was no API number matching a permit to the spud, possibly caused by an error in the API number entry, lost files, or the data simply were not published online.
Now the question is whether Sourcewater can reduce its false positive rate to a level that provides a more reliable drilling predictor in place of permitting data. “We had some very good preliminary results, we’re continuing to refine those, and we hope to have a product launched very early in 2019,” Adler said.
Zooming In Closer
Taking a similar approach to identifying well pads is Planet, a vertically integrated Earth imaging firm with a more than 7-petabyte imagery archive serving a variety of industries. It says it operates the largest constellation of satellites in space at around 150. Google is both a customer and an equity stakeholder in the company.
Planet entered the energy industry about a year ago and was drawn to the Permian because of its activity explosion. It first offered a medium-resolution mosaic of the entire basin using a week’s worth of daily imagery where obstructions such as light cloud cover are removed. From those high-level images, it works on different sets of use cases for its clients depending on the kind of information they want.
“We’re passively imaging the entire Earth on a daily basis,” said Deven Desai, energy solutions lead at Planet, which launches new satellites into orbit every 3–4 months.
Currently, it too is combing through RRC data while applying a computer-vision approach to training the centroid latitude and longitude of a given pad. “Then we train the model to figure out if we can find new pads,” Desai said. “We’re noticing about a 20-day latency in some regions of the Permian where the Railroad Commission dataset updates a little too late,” he said.
Planet is working to increase the model’s accuracy rate before commercializing the product. Phase 2 will be tracking development over time from one or multiple pads, showing when a pad is cleared, rig comes on site, and frac crew assembles.
A time-lapse sequence tracking the early evolution of a Permian well pad from August 2017 to March 2018. Source: Planet.
Desai noted that Planet’s ownership of the entire satellite imagery analytics process—from image acquisition to data insight—gives the company flexibility in what it can offer clients.
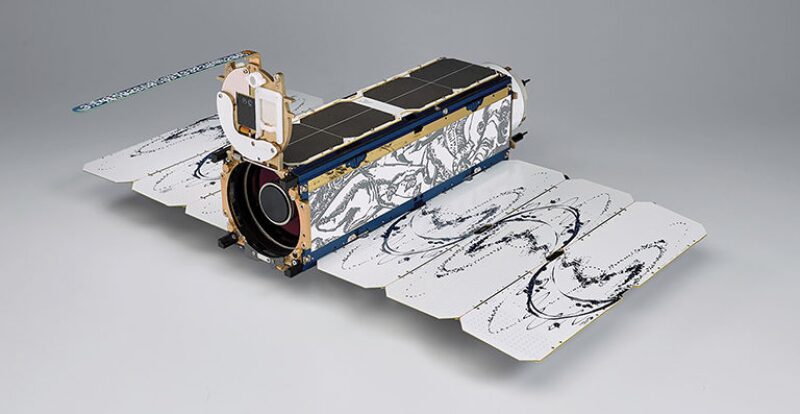
“We started by actually building a satellite ourselves using commercial off-the-shelf parts,” he said. These miniature satellites, which Planet calls “Doves,” are about 10×10×30 cm, medium resolution, and most used by the company. Planet currently has around 130 in orbit. It also has five RapidEye satellites, also medium-resolution, and 13 high-resolution satellites called SkySats, whose images are 72 cm per pixel.
Doves passively take images at 3 m per pixel twice a day via line scan as the Earth rotates, meaning they are trying to capture as much of the planet below them as possible. These account for the broader, regionwide insights gleaned by the company. High-resolution SkySats tend to be used more deliberately, zooming into a selected target area to draw more specific insights. Planet is looking into using the SkySats for right-of-way monitoring by utilizing their near-infrared band to observe changes on the ground such as vegetation growth, soil disturbance, and water levels.
Images taken by its satellite fleet are transmitted to the company’s network of 30 ground stations and then sent to Google Cloud for data processing. Clients gain web and application program interface access to updated and archived imagery.
Planet employs a spatial information feed concept, which is becoming a standard for performing web feature delivery by most imagery analytics providers, Desai said. This is part of a larger web feature service (WFS 3.0), which is “a relatively standardized way of defining features,” he explained. “It’s generally done at an [application program interface] service level. It’s basically just the JSON data blob that lets you understand what the attributes and value pairs are.”
Planet soon intends to release a road-detection model. For now, this consists of a raster, or merely a grid of pixels showing where Permian road networks have been expanding. When it is commercialized, those roads will become vector datasets, so users, such as GIS mapping services, will be able to assign attributes to them. That is expected in next year’s first quarter, Desai said.
“And this is something that customers tend to want, because we’re not going to assume ExxonMobil’s workflow,” Desai said. “We’re not going to assume Schlumberger’s or Halliburton’s workflow. They’re going to want to add their own labels or their own little details and descriptions for each given road or each given portion of a network.”
As the industry begins to request more custom services, Planet will try to accommodate. “But what you will notice with Planet and any other imagery analytics partner that’s out there, these are still very greenfield technologies,” Desai said.
Permian Completions Decline Observed
Real-time completions monitoring was introduced into the satellite imagery analytics space this fall as Westwood Global Energy Group unveiled its SatScout service. It identifies full development activity including pad construction, drilling activity, and fracturing work for the Delaware and Midland Basins. After a completion has occurred, it typically doesn’t show up in public filings until 30–120 days afterward.
Westwood has been collecting and reviewing satellite imagery and other data sources over the past 9–12 months. “Over that period of time, there’s been many more satellites launched into orbit,” said Todd Bush, vice president, commercial at Westwood. “So we’ve actually gone from essentially one image every 2 weeks to now seeing imagery every 2 to 3 days, and often we can get close to daily imagery for areas in the Permian, the Eagle Ford, and even the Haynesville.”
SatScout covers all public and private Permian operators, including Pioneer Natural Resources, XTO Energy, Chevron, Apache, EOG Resources, Parsley Energy, and Callon Petroleum. Clients receive either basin-level monthly updates or operator-specific alerts via CSV files, application program interface feeds, and email alerts.
In a sample dataset for September, findings from the service showed how bottlenecks and crude price differentials continued to impact Permian well completions activity, which dropped 6% from August to 472 wells. This resulted in a loss of 185,000 tons of frac sand demand and 375 million gal of water demand for fracturing jobs. Completions activity for the basin’s top 15 operators fell 8% month-over-month, with one operator’s completion activity more than halving, Westwood reported.
In a second-quarter dataset, SatScout data showed that Cimarex Energy fell short of its completion guidance by 28%, but Energen completed 86% more wells than it previously said it would.
Westwood is in the process of scaling the technology to multiple basins, bringing Appalachia and the Midcontinent region into the fold. The additional coverage, Bush noted, will require training new neural networks to account for different geographies and their unique features in satellite imagery.