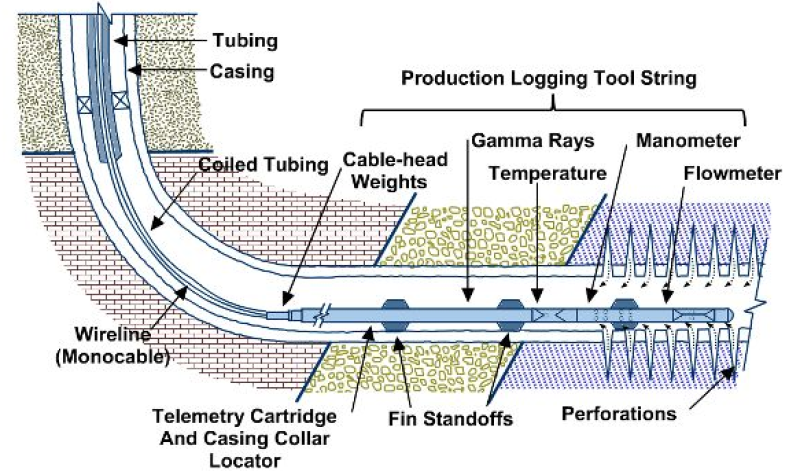
Production logging encompasses a number of well-logging techniques run on completed injection or production wells. The main goal is to evaluate the well or reservoir performance. It is used as a well diagnosis tool to aid in uncovering the cause of poor well performance, measure the effectiveness of various workover operations, and provide a time-lapse surveillance of injection/production profiles to support reservoir management. In many cases, production logs indicate remedial action to be taken to improve well productivity. Production profiling in vertical and horizontal wells have their own challenges and proper planning and execution is required for achieving desirable output from these logs.
Identifying the Cause of Poor Well Performance
Production logging is typically used as a supplement to pressure-transient testing in diagnosing poor well performance. The first question to answer is whether the cause is related to the reservoir or completion. In many cases, a combination of the two data analyses is needed such as identifying which interval has a low productivity index.
Some of the more typical production problems are
1. Poor initial performance
- Damaged zone causing significant skin effect around wellbore, plugged or ineffective perforations
- Poor depth control during completion
- Improperly sized tubing
- Drawing down below bubblepoint pressure
- Thief zones created by comingling high- and low-pressure zones
2. Excessive gas or water production
- Encroachment of water-oil-contact (WOC) or gas-oil-contact (GOC), water or gas coning
- Fingering through high-permeability zones
- Channeling from a nearby zone
- Casing damage
- Leaking bridge plug
3. Abnormally low productivity
- Reservoir pressure decreases
- Near-wellbore permeability loss due to particulate movement
- Fracture closure, restriction due to sand fill, plugged perforation or gravel pack
- Increase in hydrostatic head due to increased production of a heavy phase
4. Miscellaneous problems
- Sand production
- Tubing, casing, or packer leaks

Well Diagnostic Needs
Click on the links below for the possible causes, recommended logging services, and comments for each type of surface indications of poor behavior or logging objective:
| Multiphase Flow in Production Wells | Single-Phase Injection Wells |
| Low Productivity | Low Injectivity |
| Excessive Water Production | Abnormally High Injectivity |
| Excessive Gas Production | Low productivity in Offset Producers |
| High Water Production | |
Drilling/Well Completions | |
| Well Treatment Design and Evaluation | |
| Fracture-Height Measurement | |
| Mud Kick or Lost Circulation | |
| Evaluation of Perforation Performance | |
| Locating Top of Cement | |
Multiphase Flow in Production Wells
Surface Indication of Poor Behavior/Logging Objective: Low Productivity
Possible Causes
- Low formation permeability
- Plugged perforations
- Near-wellbore damage
- Wellbore restrictions
- Channeling or crossflow
Recommended Logging Service: Flow profile (press-temp-spin), Pressure buildup test
Comments: Production profile measured with spinner indicates low-productivity intervals. Pressure transient tests will also distinguish between low permeability and near-wellbore or perforation damage. Channeling or crossflow may be indicated by temperate or flowmeter logs.
Surface Indication of Poor Behavior/Logging Objective: Excessive Water Production
Possible Causes
- High permeability
- Channeling
- Coning
Recommended Logging Service: Temperature, spinner and density or capacitance
Comments: A combination of spinner and density or capacitance log can be used to locate water entries. Water channeling may be located with the temperature log. Some special tests or sequence of logs run at different rates may confirm coning.
Surface Indication of Poor Behavior/Logging Objective: Excessive Gas Production
Possible Causes
- High-permeability zones
- Production from gas cap
- Channeling
- Coning directional permeability, barriers, poor pattern placement, etc.
Recommended Logging Service: Temperature, spinner, density and dielectric
Comments: Temperature log may indicate production by cool anomalies. Combination of spinner and density (gradient or gradio) logs may locate gas entries.
Single-Phase Injection Wells
Surface Indication of Poor Behavior/Logging Objective: Low Injectivity
Possible Causes
- Low formation permeability
- Plugged perforations
- Near-wellbore formation damage
- Wellbore restriction
Recommended Logging Service: 1. Flow profile (Press-Temp-Spin), Pressure falloff test
Comments: Injection profile measured with spinner will indicate low-injectivity intervals. Comparison with core data or open-hole logs may distinguish between low permeability and plugged area (perforations or formation).
Surface Indication of Poor Behavior/Logging Objective: Abnormally High Injectivity
Possible Causes
- Channeling
- Tubing Leak
- Casing leak
- Packer leak
- Fractured reservoir
Recommended Logging Service: Temperature and spinner log, Step-rate test, Falloff test
Comments: Temperature log can indicate channels or leaks. Spinner can suggest channeling or leaks by shape of profile or measured fluid velocity. A fractured reservoir is suggested by absence of channels or leaks as determined by logs. This can be confirmed with a step-rate or falloff test.
Surface Indication of Poor Behavior/Logging Objective: Low Productivity in Offset Producers
Possible Causes
- Channeling or leaks
- Problems in producers
- Reservoir problems – directional permeability, barriers, poor pattern placement, etc.
Recommended Logging Service: Temperature and spinner log, Falloff test
Comments: If no problems are found in injection well, production well should be tested with production logs and/or pressure-transient tests.
Surface Indication of Poor Behavior/Logging Objective: High Water Production
Possible Causes
- High-permeability zones
Recommended Logging Service: Temperature and spinner log
Comments: Injection profile measured with spinner should locate high-permeability zones. Temperature log may indicate a high-permeability zone in a young well.
Drilling/Well Completions
Surface indication of poor behavior/logging objective | Possible causes | Recommended logging service | Comments |
Well treatment design and evaluation | Required workover | Flow profile logs (Press-Temp-Spin-Gradio-and/or-DIEL) | Many well treatments require flow profile before and after treatment for design and analysis. |
Fracture-height measurement |
| Shut-in temperature | Temperature log measures fracture height based on cooling by the fracture fluid. |
Mud kick or lost circulation | Underground blowout | Temperature log | Temperature log responds to flow into the formation similar to an injection well. |
Evaluation of perforation performance |
| Flow profile logs (Press-Temp-Spin-Gradio-and/or-DIEL) | Performance of perforations is inferred from the productivity or injectivity of zones perforated. |
Locating top of cement |
| Temperature log | Temperature log run shortly after cementing shows region opposite cement resulting from heat of hydration. |
Production Logging in Horizontal Wells
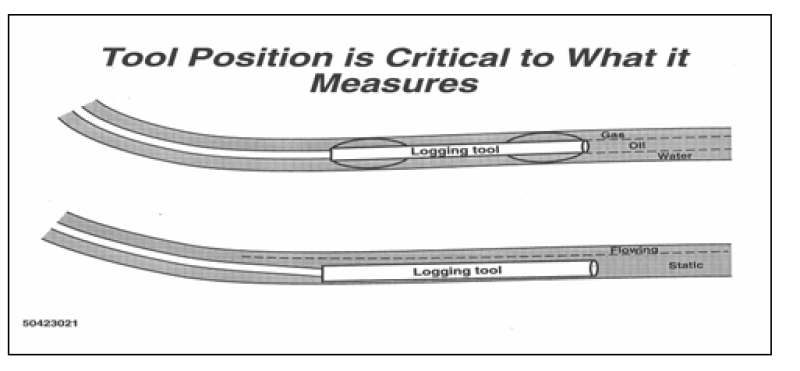
Well flowing conditions are different for horizontal and vertical wells, which require modifications to the tools and interpretations techniques. Phase segregation and fluid stratification are observed in horizontal wells. These phenomena lead to multiphase flow thus making the responses of production tools unpredictable.

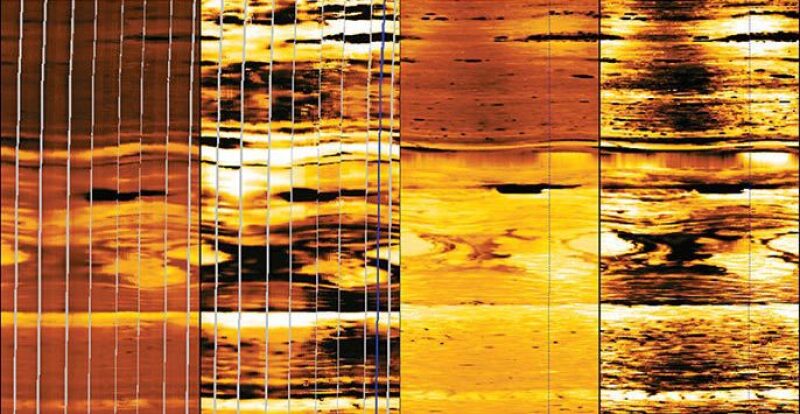
The main challenge facing production logging in horizontal wells is that trapped fluids can directly affect production and influence the data from a production log, especially for sensors such as spinners and capacitance tools. Because horizontal wells have doglegs and undulations, stagnant water may lie either inside or outside the casing in low areas at the bottom of the well, and stagnant gas may accumulate on the high side of hole undulations. However, applications of modern production-logging methods have helped to make significant production gains. Conventional production logging could not evaluate the individual interval contributions or identify the sources of water production. This led to development of new technology tools with a range of small sensors that covered the full width of the wellbore and could be placed close together to improve depth resolution. The latest techniques provide real-time holdup and velocity profiles along a vertical axis of the borehole cross-section. The sensors distinguish between gas and liquid using optical refractive index measurements. Thus, it gives a better understanding of production regimes and defining accurate flow profiles, which consequently help in planning more efficient workover or production strategies and improve ultimate hydrocarbon recovery.
References
ARC Production Log Service Catalog
Production Logging, Schlumberger
Hill, A.D., Production Logging: Theoretical and Interpretive Elements, SPE Monograph Series, Vol 14.

Lavish Garg is a formation evaluation engineer at Weatherford in India. His job scope involves interpretation of wireline well logs focussing on well Integrity issues such as pipe assessment for corrosion and cement problems. He brings a wide range of experience encompassing real-time drilling data, data analytics, and well log evaluation. He represented his college at the 2016 PetroBowl competition held during the SPE Annual Technical Conference and Exhibition in Dubai, and is a past president of the Maharashtra Institute of Technology (MIT) Pune Society of Petroleum Geophysicists Student Chapter. Garg holds a bachelor’s degree in petroleum engineering from MIT Pune, India.


