In Part 1 of this series, the author noted that historically, the sizing of three-phase separators, in particular for oil/water separation, has been based on the specification of residence time criteria, which is an imprecise method as residence time alone fails to capture many of the parameters/variables that clearly should have an impact on liquid/liquid phase separation performance, such as feedpipe conditions, inlet device type, phase flow distribution inside the separator, vessel length/diameter ratio, fluid properties, and dispersed phase droplet sizes. A more analytical approach was described, and the following base case example illustrates the methodology.
Base Case Example
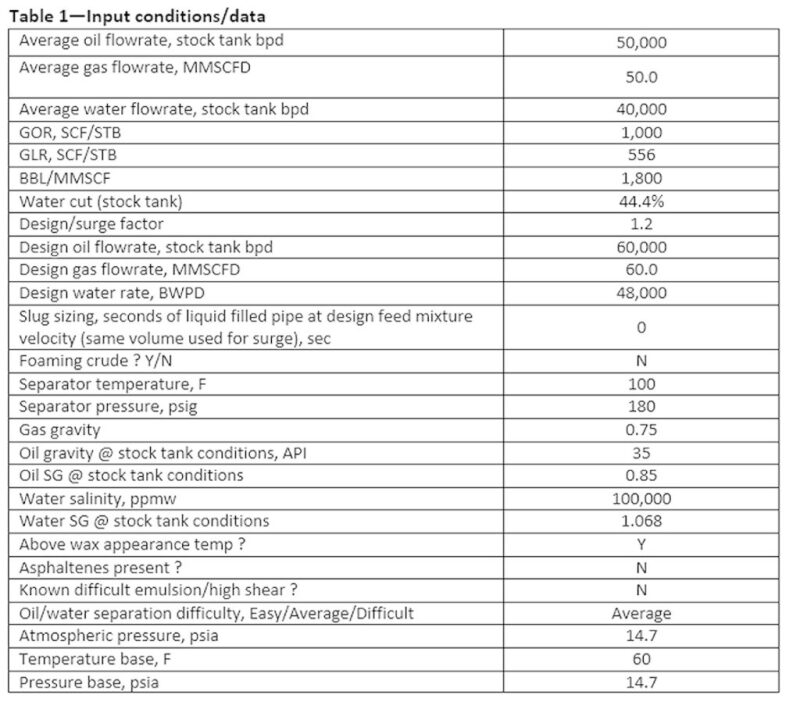
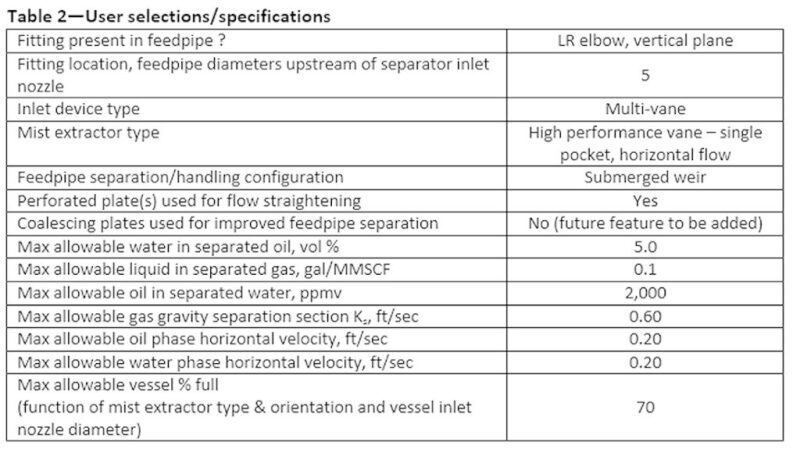
Below is a summary of selected key information.
Results


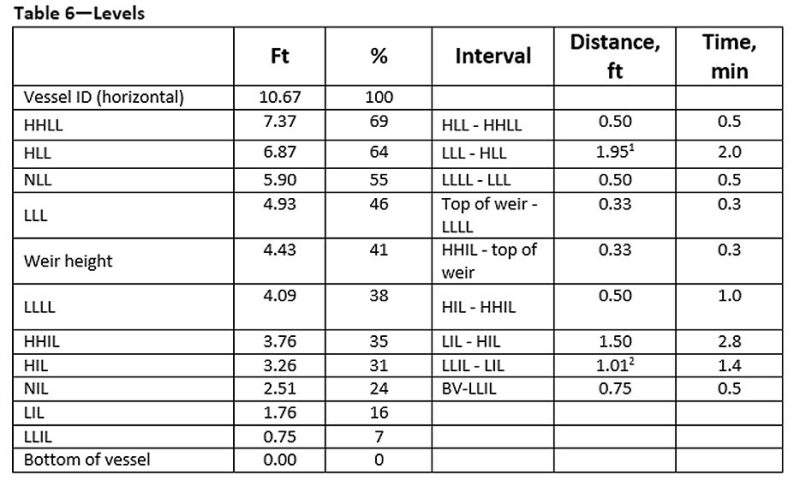
1The LLL–HLL distance is greater than the 1.5-ft minimum in order to satisfy the 2.0 minute holdup/intervention time requirement.
2The LLIL–LIL distance is greater than the 0.5-ft minimum in order to satisfy Vh,max = 0.20 ft/sec limit for the water phase.
BV—Bottom of the vessel
ID–Inside diameter
HHIL—High-high interface level
HHLL—High-high liquid level
HIL–High interface level
HLL—High liquid level
LIL–Low interface level
LLIL—Low-low interface level
LLL—Low liquid level
LLLL—Low-low liquid level
NIL–Normal interface level
NLL—Normal liquid level
General Observations of the Base Case Sizing Results
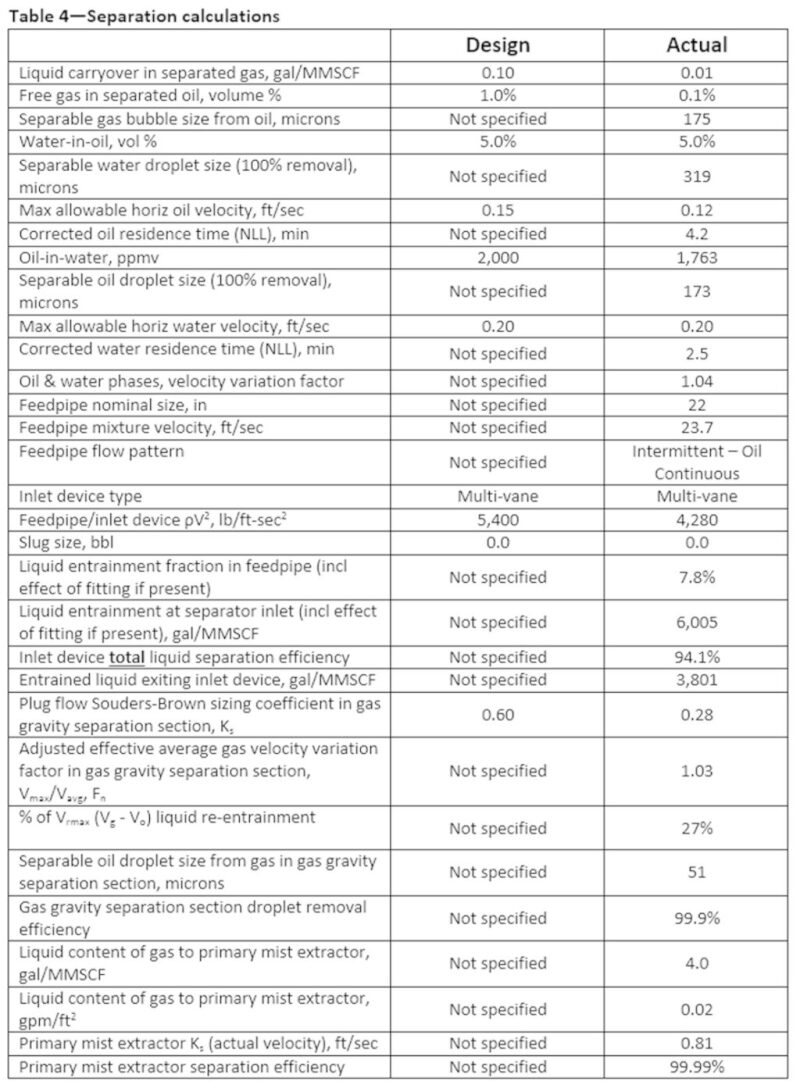
This is a liquid-dominated separator application, despite the fairly large volume of gas (50 MMscf/D) and relatively low operating pressure (180 psig).
- The HHLL is at the 69% level.
- The Souders-Brown Ks value for the gas gravity separation section is relatively low for a horizontal separator (Ks= 0.28).
- The separable oil droplet size (gas gravity separation section) is small (51 microns).
- The gas velocity across the oil surface is only at approximately 27% of the re-entrainment velocity.
- The HHLL is at the 69% level.
The vessel diameter of approximately 11 ft is driven mainly by the following factors:
- The assumed submerged weir liquid-handling configuration. Of the various liquid-handling configurations available, including overflow weir, bucket and weir, and heavy (aqueous) phase boot, the submerged weir design typically will result in a larger diameter in order to accommodate the minimum distances/times between the criteria typically employed for levels.
- Generally speaking, it is the requirement for the minimum distance between levels that typically has the most impact on diameter, assuming the “times between levels” requirements are not overly conservative.
- The horizontal velocity limit, Vh,max = 0.20 ft/sec for the water phase is forcing the LLIL–LIL distance above the minimum.
- The assumed submerged weir liquid-handling configuration. Of the various liquid-handling configurations available, including overflow weir, bucket and weir, and heavy (aqueous) phase boot, the submerged weir design typically will result in a larger diameter in order to accommodate the minimum distances/times between the criteria typically employed for levels.
The calculated “corrected” residence times (adjusted for nonuniform velocity profiles) for the oil and water phases look reasonable in comparison to the calculated separated phase qualities:
- Corrected oil residence time of 4.2 minutes and 5.0% v/v water-in-oil (WIO).
- Corrected water residence time of 2.5 minutes and 1,763 ppmv oil-in-water (OIW).
- Corrected oil residence time of 4.2 minutes and 5.0% v/v water-in-oil (WIO).
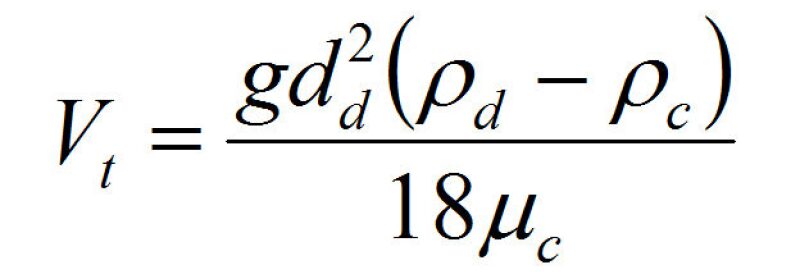
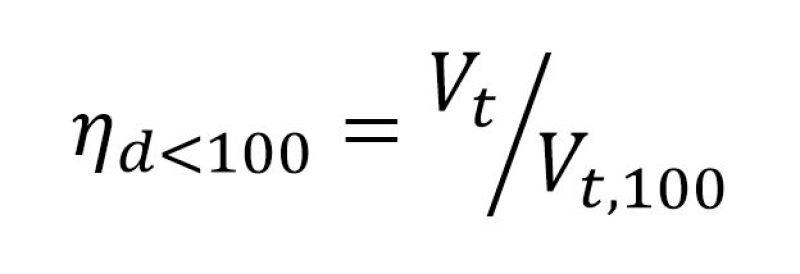
The calculated separable droplet sizes (100% removal) for each liquid also look reasonable.
The use of a multivane inlet device combined with perforated plates has a beneficial effect on the phase velocity profiles/flow distributions which helps gravity separation performance significantly.
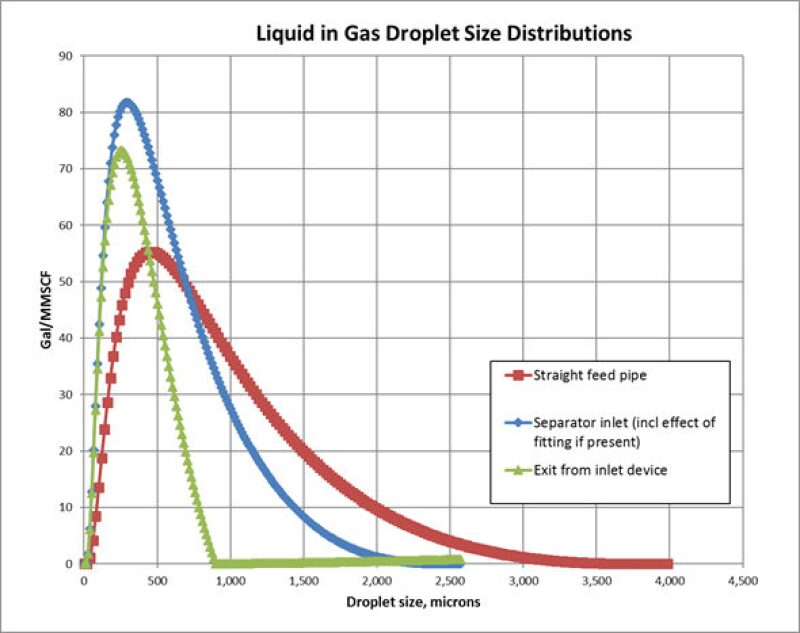
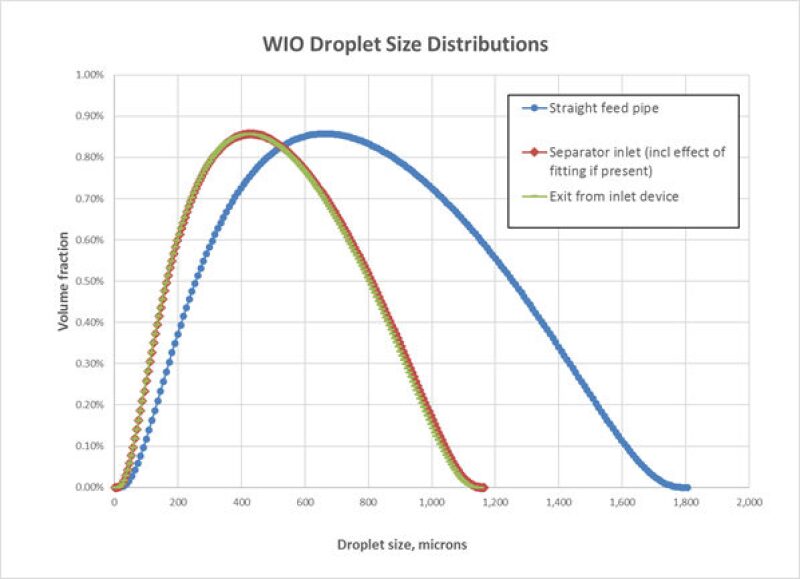
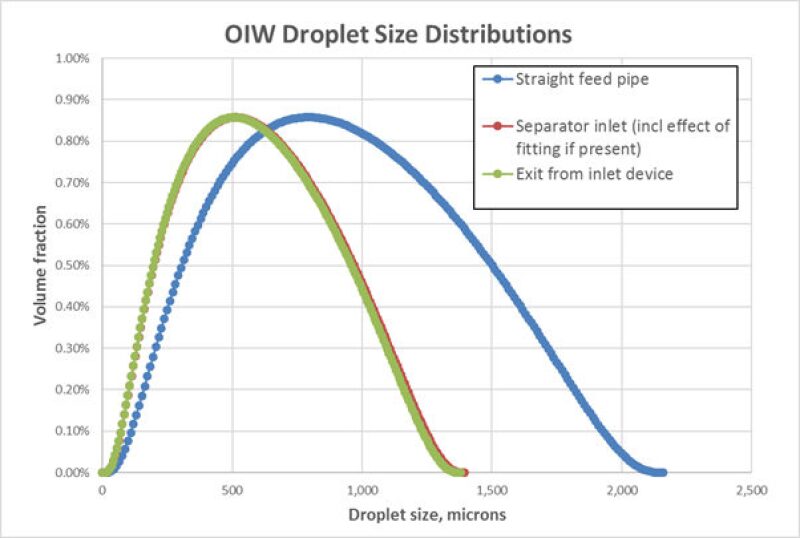
Droplet size distributions
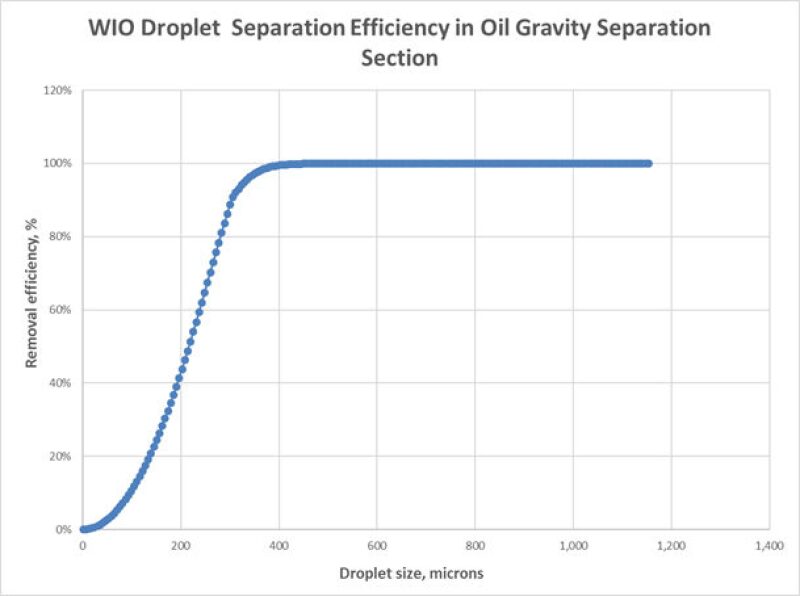
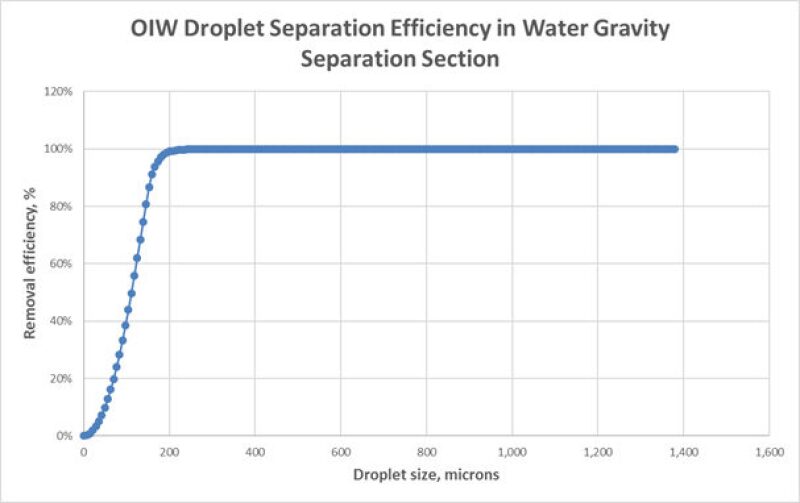
Figs. 1–3 show the calculated droplet size distributions for the base case.
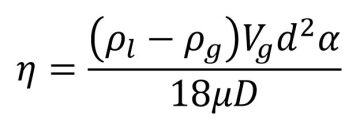
Oil/water droplet separation efficiency

|

|
|
|
Case Studies
The effect of varying selected variables/parameters is investigated. All other variables/parameters are the same as the base case presented above.
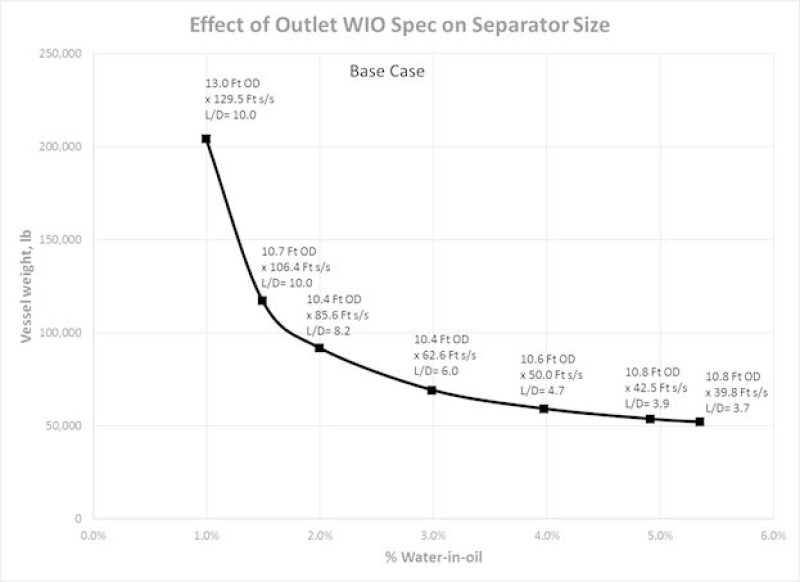
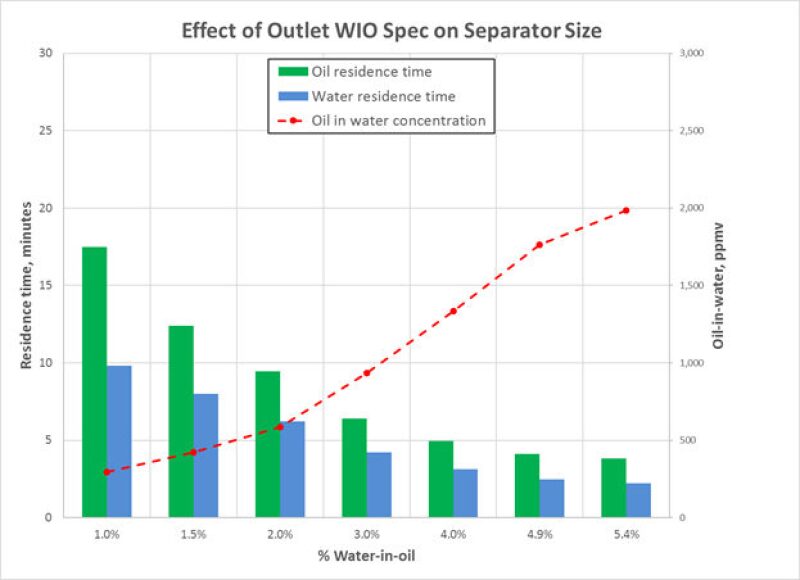
Effect of outlet water-in-oil spec on separator size
Effect of temperature on separator size
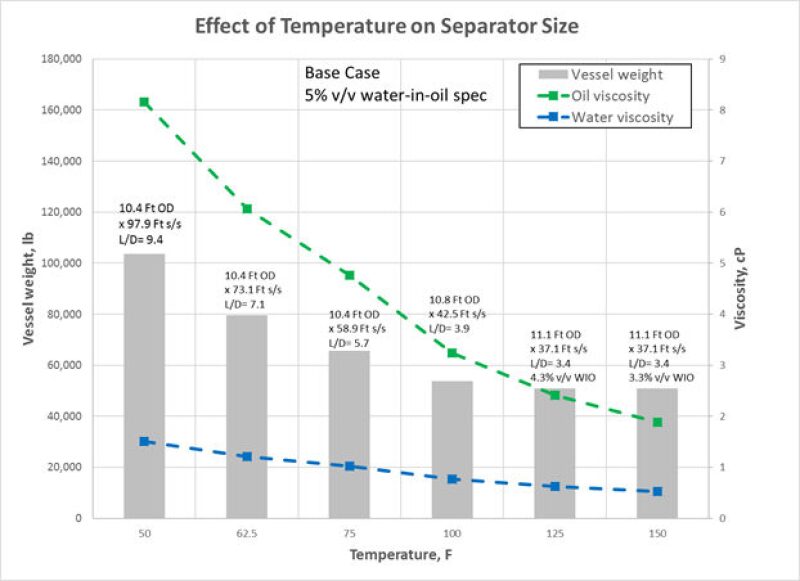
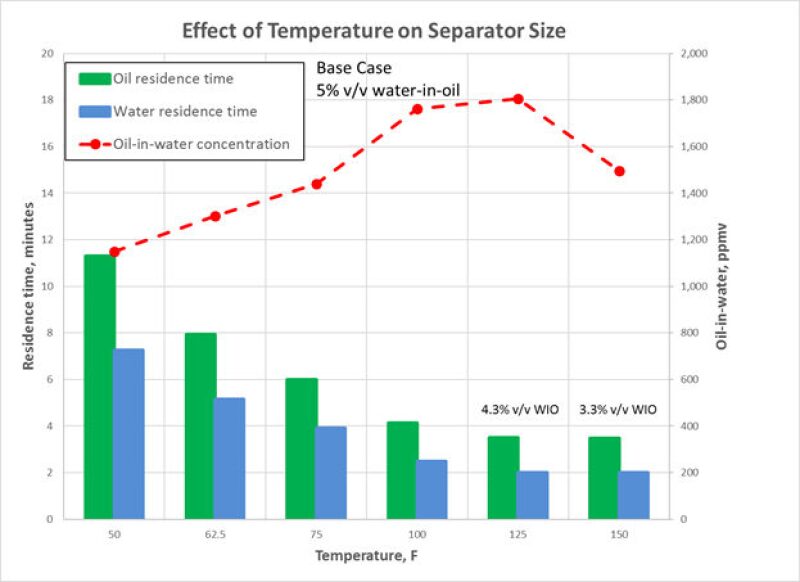
The outlet OIW concentration is generally increasing with increasing temperature. At first glance, this seems counterintuitive. Certainly the water viscosity is decreasing with increasing temperature (Fig. 8), which should help separation. However, the OIW specification is set at 2,000 ppmv and is not constraining separator size. The WIO specification of 5% v/v is controlling the separator size. As temperature increases, the separator size quickly decreases mainly because of the rapid decrease in oil viscosity. The benefit of decreasing water viscosity is more than offset by the reduction in separator size—in particular, length—resulting in declining oil droplet separation performance, even as temperature increases.
The 125°F and 150°F cases result in identically sized separators (Fig. 8) while both achieving less than the 5% v/v WIO specification. The outlet OIW concentrations also peak and start to decline. The hotter temperatures make oil/water separation easier for both continuous phases but the separator length is prevented from becoming shorter by the “minimum times between levels” requirements for the oil phase. It should be noted that the times between levels requirements for the oil phase are more onerous than for the water phase as it is the combined (oil + water) flow rates that are used for the levels in the oil zone, whereas just the water flow rate is used for the levels in the water zone.
Effect of oil API gravity on separator size
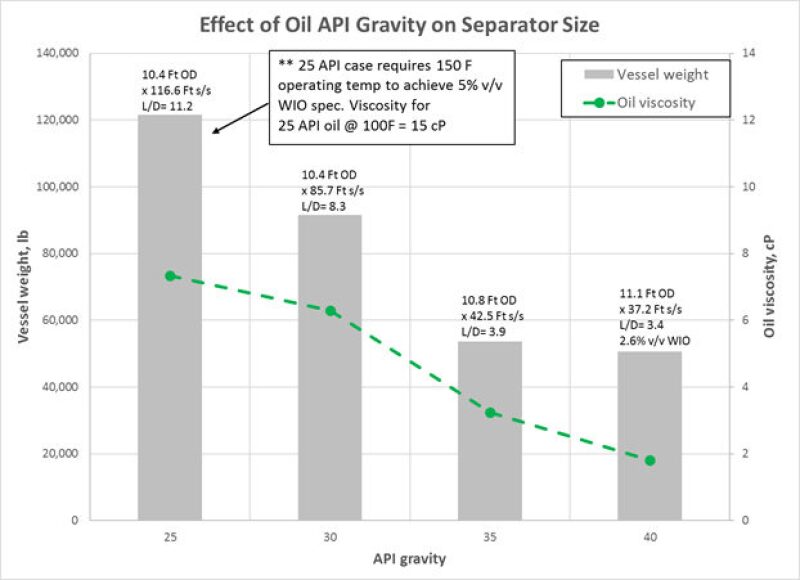
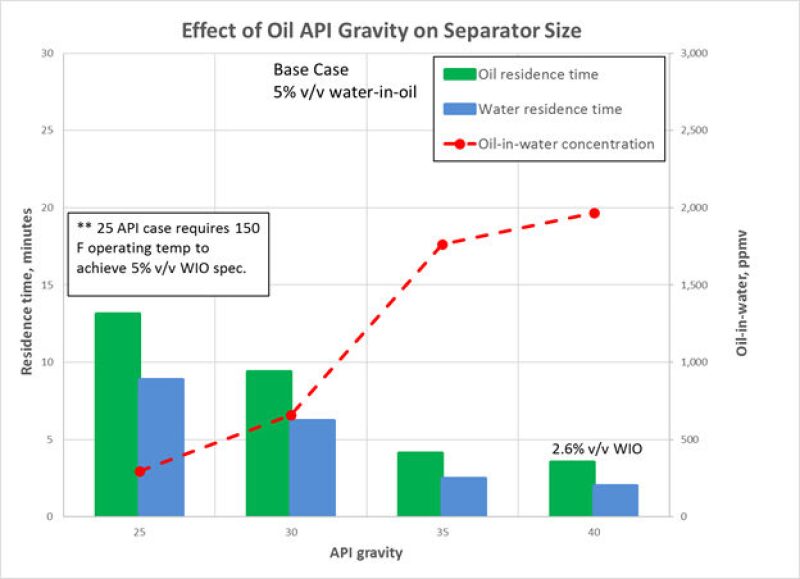
The current calculations indicate that for the 25 °API oil it is not possible to achieve the 5% v/v water in oil specification at 100°F within the vessel size constraints utilized. A correlation is used for the oil viscosity vs. API gravity and temperature relationship.
Conversely, for the 40 °API oil, it is relatively easy to achieve the 5% v/v spec and in fact an outlet WIO level of 2.6% v/v is obtained. In this case, the optimization routine used for performing the sizing calculations could not drive the separator size smaller consistent with the 5% v/v WIO specification mainly because the times between levels requirements for the oil zone were constraining the minimum vessel length.
Effect of feedpipe diameter on separator size
Effect of inlet device on separator size
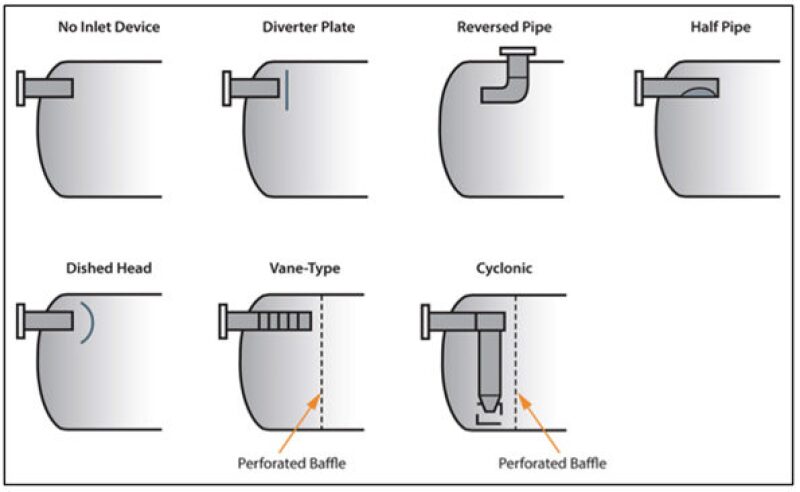
For the purposes of this article, the diverter plate configuration will be taken as representative of this group of inlet device types. The “no inlet device” configuration as shown would not be used in a horizontal vessel. The reversed pipe configuration is sometimes used but its performance with respect to three-phase separation efficiency is not likely to be much different than the diverter plate or dished head.
For all cases it is assumed that a perforated plate is installed to help improve flow distribution in the gas, oil, and water phases. This subject was covered in Part 1, Part 2, and Part 3 of the gas/liquid series of articles.
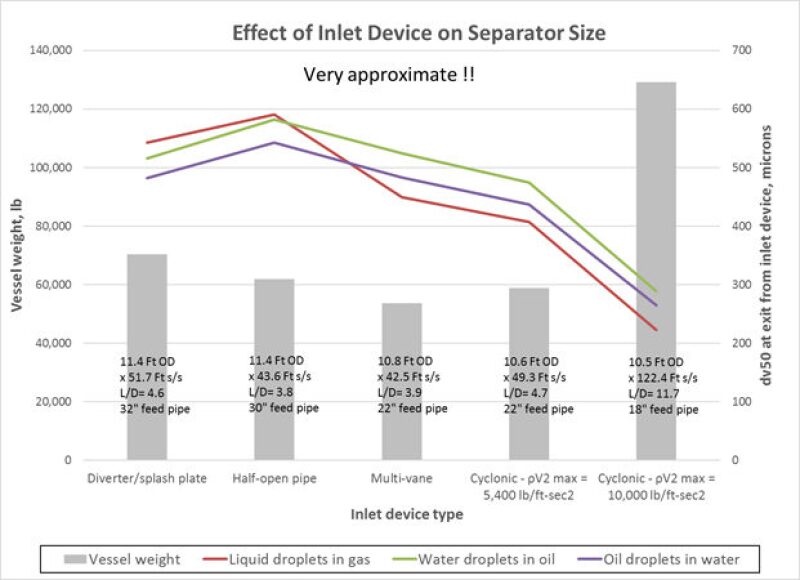
The type of inlet device utilized impacts separator size and performance in four main ways:
- The droplet sizes and droplet size distribution of the dispersed phases
- The amount of bulk liquid re-entrained as dispersed phase
- The velocity profiles of the continuous phases in the gravity separation regions of the separator
- The effective “release points” (vertical position) of the dispersed phases relative to the continuous phase layer height
These topics have been covered earlier in this article. The effect of Item 3, the velocity profiles of the continuous phases, has been lessened appreciably by the assumption that perforated plates are utilized in all cases for flow-straightening purposes. Even with the perforated plates, there are differences in the velocity profiles between inlet devices, but these effects are fairly small. It must be noted that the quantification of actual velocity profiles and their variations is best done by computational fluid dynamics (CFD) modeling with validation via empirical testing. The approach used here, and in the Excel spreadsheet, is approximate only.
Regarding Item 4, the effective release point, the same assumption has been made for all inlet types: the dispersed phase is released uniformly over the vertical height of the continuous phase at the centerline axis of the vessel at the start of the gravity separation section—basically at the perforated plate location.
The primary cause of the difference in vessel sizes shown in Fig. 14 is due to Item 1, the droplet size distribution, which is mainly dictated by the feedpipe size and the assumed level of turbulence/shear associated with flow through the given inlet device.
As discussed earlier, calculations have been included to estimate the removal of liquid droplets from gas by the inlet device, but no prediction of removal of dispersed liquid phase droplets is included. This is probably a reasonable assumption for most of the inlet device types, except for possibly the cyclonic inlet device, where the effect of the generated centrifugal forces should be expected to separate at least the larger water droplets from the oil, and oil droplets from the water, although to what degree this separation is “undone” due to turbulence associated with the combined oil/water mixture flow exiting the cyclone underflow is unknown.
Using the typically quoted ρV2 limit for a cyclonic inlet of 10,000 lb/ft-sec2 results in a very large separator size caused by the small droplets associated with the small feedpipe diameter. The cyclonic inlet likely does a good job of removing liquid droplets from the gas at high inlet ρV2 values but it is the effect on dispersed oil and water droplet sizes that is predicted to be problematic for this application.
While it is generally assumed that the vane-type and cyclonic inlets should be “better” than the others with respect to shear/re-entrainment effects, this performance advantage may be less than actually achieved in practice, the main reason being that the larger feedpipe sizes associated with the lower ρV2 limits for the simpler inlet devices go a long way toward mitigating the droplet shearing effects of these devices.
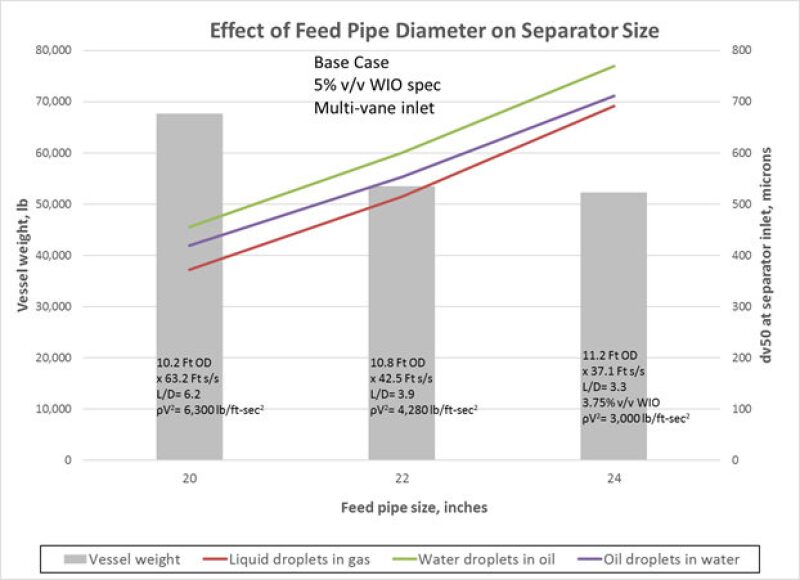
With respect to this topic, a point that could be made is that while the available literature routinely quotes increased inlet momentum (ρV2) values for the more “sophisticated” inlet devices, with the supposed benefit of smaller diameter separator feedpipes and vessel inlet nozzles, it does not necessarily follow that this practice should be employed. As has been shown in this article, reduced feedpipe diameter will increase fluid velocities, reduce droplet sizes, and increase entrainment which will make subsequent phase separation more difficult.
A smaller diameter feedpipe would not be expected to offset the cost of a larger separator which would likely be needed to deal with the resulting smaller droplet sizes and increased dispersed phase entrainment loads. A final observation regarding this subject is that there is some evidence that the published ρV2 limits for the various inlet devices might be more relevant for gas-dominated applications, such as scrubbers, and maybe less so for highly liquid-loaded applications.
Again, the information in Fig. 14 is approximate only, but does show that better quantification of inlet device performance in this manner—without the need for sophisticated modeling software—is within reach. This area in particular will benefit from further CFD/empirical testing, which allows better “tuning” of models as described here.
Conclusion
The purpose of this article and Part 1 is to illustrate a new methodology for sizing and rating three-phase separators that is based on quantifying the actual mechanisms and physics that govern phase separation performance in typically used equipment. In particular, quantification of dispersed phase droplet sizes and entrainment levels, in conjunction with the design aspects that influence them, are a key focus of this work
While there is significant room for improving certain aspects of the proposed methodology, the calculations involved, while complicated, are believed to be logical, manageable, and a significant improvement relative to current industry methods for sizing and rating three-phase separators. Further work is needed, such as CFD, lab testing, and actual field data, to better quantify several areas of this methodology that are at present, fairly approximate.
For Further Reading
Bothamley, M. 2013. “Gas-Liquid Separators—Quantifying Separation Performance Parts 1–3,” SPE Oil and Gas Facilities, August–December. Part 1; Part 2; Part 3.
Miedema, S.A., Vlasblom, W.J. 1996. “Theory for Hopper Sedimentation,” 29th Annual Texas A&M Dredging Seminar, New Orleans, June.

Mark Bothamley is an independent consultant specializing in oil and gas processing and associated facilities and is president of Mark Bothamley Consulting LLC. For the past several years he has been a senior technical advisor for PetroSkills, a large technical training company that supports the oil and gas industry. Previously, he was chief engineer with John M. Campbell and Company in Norman, Oklahoma, for 8 years. Prior to joining JMC he was with BP/Amoco for 24 years in several locations around the world. His experience covers the areas of design, operation, troubleshooting, and optimization of offshore and onshore oil and gas production and treating facilities. Bothamley is a past chairman of the SPE Facilities Subcommittee and a former member of the GPSA Data Book Editorial Review Board. He holds a BS in chemical engineering from Lakehead University in Thunder Bay, Ontario, Canada, and a diploma in natural gas and petroleum technology from the British Columbia Institute of Technology in Vancouver, BC, Canada.

