

“All the problems of the world could be settled if people were only willing to think. The trouble is that people very often resort to all sorts of devices in order not to think, because thinking is such hard work.” —Thomas John Watson Sr., 1874–1956
In this edition, we are reminded that rigorous technical work is one of the pillars of our industry. ChristineEhlig-Economides, through her eventful career, has been there when many breakthroughs were made that have created a step change in our understanding of the mechanisms that govern the recovery of hydrocarbons. The people listed in her article have all subscribed to the rigorous analysis that was necessary, and they, as she has, have left their mark in the improved understanding we now often take for granted.
We should not stand alone in our industry, as Economides reminds us, but learn equally from others. Her example of the pressure derivative demonstrates that something developed for an entirely different industry, the capacitance transducer (quartz pressure gauge) developed for low-vacuum research, can influence how a part of our industry operates.—Andrew Lambert, Pillars of the Industry Editor
Are we running out of oil and gas? Is there a sustainable development reason to reduce our consumption? How should we, in the upstream petroleum industry, react to claims that carbon dioxide emissions are causing climate change? Even the major oil companies give lip service to the claim. Now BP is Beyond Petroleum. ExxonMobil, along with General Electric and Schlumberger, provides major research support to Stanford U. in the Global Climate and Energy Project. At Rice U.’s Baker Inst., we find the Shell Center for Sustainability.
While upper management panders to environmentalists, the young minions keep slogging it out, delivering the oil and gas that is desperately needed all over the world as though there will be no end to it. Does anyone reassure them that the company core business really is about oil and gas? Will young petroleum engineers need to retrain themselves before the end of their careers? Before I answer this question, let me provide a brief narrative about my own career in our great industry.
As I waited somewhat nervously to give my first technical presentation in 1975, several papers were introduced with an anecdote about the speaker’s experiences 25 years before. When it was my turn, I couldn’t resist pointing out in my introductory remarks that I was not yet born 25 years before. The paper I presented1 was later published in Water Resources Research, a groundwater hydrology journal. Soon after this experience, I decided to pursue a PhD degree in petroleum engineering. I loved modeling flow through porous media, and I thought modeling three phases instead of just water would be even more interesting. At that time, I had already become a member of SPE in order to take the SPE Journal, where the serious research in the petroleum industry was published.
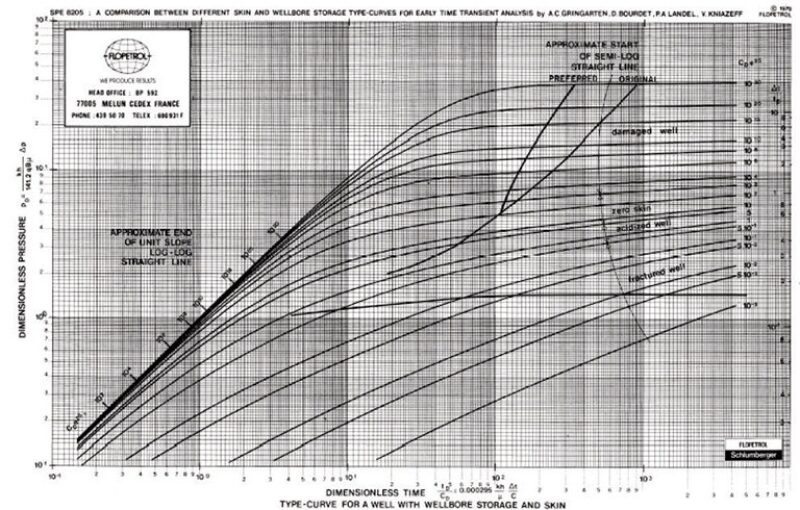
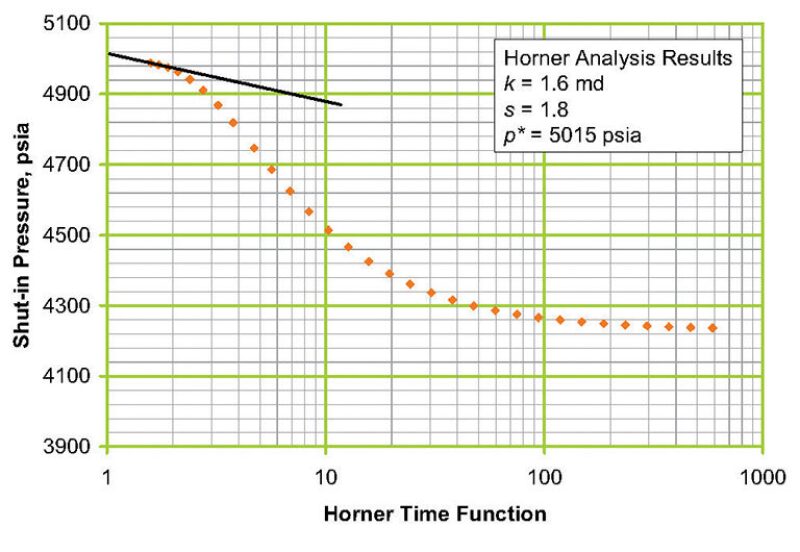
My timing on the technical front could not have been better. My PhD adviser at Stanford was Professor Henry J. Ramey Jr., one of the all-time giants in reservoir engineering, and especially in well testing. Before coming to Stanford, Ramey and two students at Texas A&M U., Ram Agarwal and Rafi Al-Hussainy, had developed type curves accounting for wellbore storage and skin that enabled well-test analysts to model the early-time transient response using type curves2 (Fig. 1). Before that, everyone relied strictly on finding a straight line on a Horner plot3 (Fig. 2). The problem was that some tests never exhibited the correct straight line for analysis, although it was always possible to find an apparent one—one that would lead, in many cases, to completely erroneous results.
While I was at Stanford, my student colleagues included Syed Tariq and Hugo Sandal,4 two other Ramey students who wrote the first papers using the Stehfest algorithm5,6 to numerically transform analytical models for well testing from Laplace space into real space. So many models could be easily derived when the governing equations were transformed into Laplace space. The challenge had always been to come up with a closed-form solution that related to time. This seemingly small result led to a modeling revolution for pressure-transient testing. After that, an explosion of new models presented on log-log coordinates appeared in the mushrooming well-test literature.
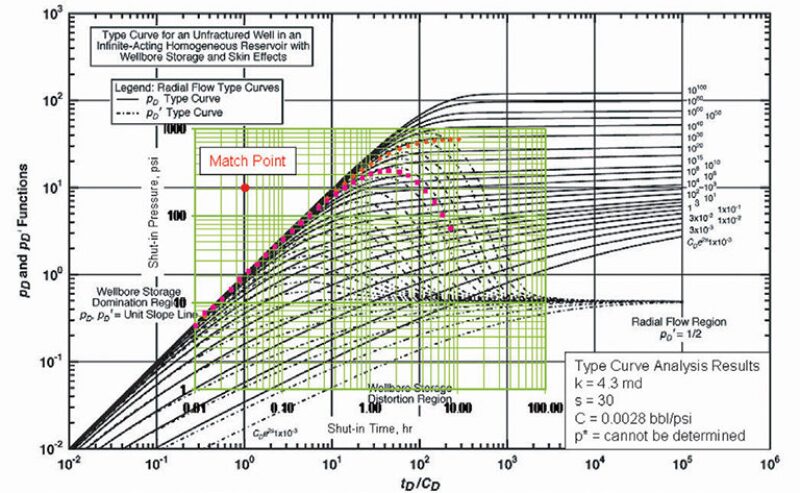
The most important development for well-test interpretation was still to come: the pressure derivative. Ironically, I was still at the U. of Alaska—Fairbanks when my graduate student, Barney Wagner,7 was working on type curves for fractured wells in elongated reservoir geometries. He showed me that the families of type curves he was generating were hardly distinguishable as pressure change on log-log coordinates, but they showed considerable character when graphed as a pressure derivative. Right then, I made an incredible blunder. I told him he was right, but that pressure data were quite noisy, that the analytical solutions were differentiable, but surely not real, data. About a month later, I went to interview with Flopetrol Johnston in France and met Dominique Bourdet. Bourdet showed me the pressure and pressure-derivative type curves he had developed8 (Fig. 3). More importantly, he showed me what differentiated quartz-gauge data looked like. I knew immediately that Bourdet was really on to something.
In Schlumberger at that time, there were two alternative technologies competing with pressure-transient-test analysis using the derivative. One was formation testing,9,10 the other production-log testing.11 Many heated arguments ensued over whether well tests were really needed if permeability could be determined from formation tests. In reality, until quartz gauges were introduced in formation testers, this argument was highly ill-conceived, but it certainly provoked a lot of animated discussion. Likewise, the idea of production-log testing was to use a flowmeter to measure the downhole flow rate during pressure-buildup tests, thereby eliminating the need for pressure-derivative analysis because the wellbore storage would be corrected by the flow-rate measurement, and an equivalent to the Horner plot would suffice. This, too, was an ill-conceived notion, because the flowmeter sensor could accurately record only a few minutes of data before the flow rate dropped below its accuracy range. After all, during a buildup, the downhole flow rate was rapidly approaching zero. Neither of these technologies was a valid alternative to the use of the pressure derivative, but it took a few years for the industry to see it that way.
The flowmeter did have a place in transient testing, though, but during drawdown, not buildup. I once was shown some data acquired in a water-injection well that was abruptly shut in from a flow rate of 30,000 BOPD. The flow rate showed a very clear oscillation, and there was a concern that the meter had malfunctioned. However, the pressure data showed the same oscillatory behavior. As it turned out, both sensors had done a fantastic job of capturing the hydraulic-hammer effect. At that time, my technical interest was in layered reservoir testing.12 In layered reservoir tests, the combination of pressure and flow rates measured at different levels in the well in response to changes in the surface flow rate permit characterization of commingled zones on a zone-by-zone basis. In this case, the flowmeter acquires data while the well is flowing, which is what it is intended to do.
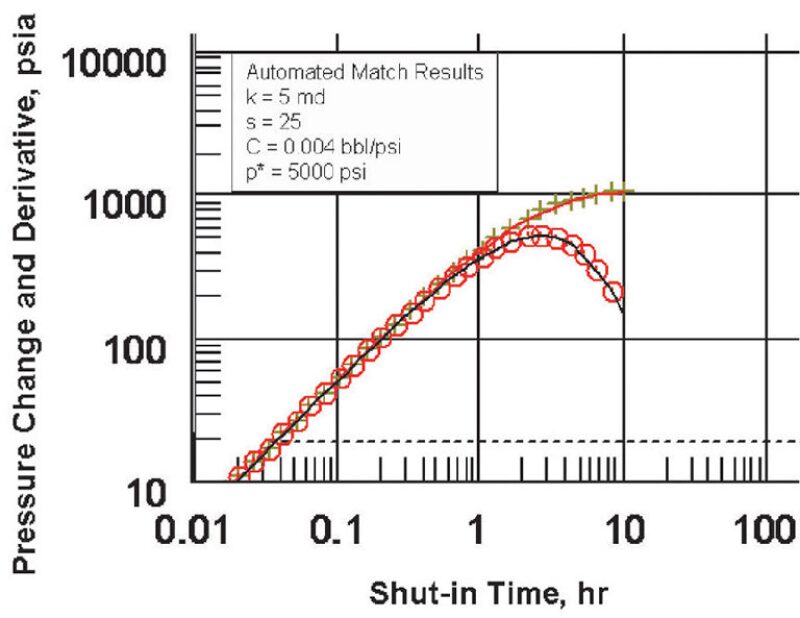
Today, I am not really a proponent of type-curve matching per se, but rather with using the derivative response to recognize flow regimes.13 We now can use data processing originally designed for convolution or deconvolution of downhole pressure and flow-rate data for analysis of production data.14 This approach is particularly effective in wells with permanent gauges. Also, we have models for horizontal and hydraulically fractured wells, homogeneous and heterogeneous reservoirs, and a host of useful boundary geometries. Many of these models may require transients much too long to be practical in a well test, but may be quite effective for analysis of production data (Fig. 4.)
After 7 of my 20 years with Schlumberger, I left transient-test analysis for several other pursuits, and as before, my timing continued to be great. Three-dimensional-seismic-data acquisition and interpretation and borehole images became widespread while I worked in integrated reservoir characterization. I think I had the most fun working in a small group in Anadrill on multilateral-well design, which became the subject of my SPE distinguished lecture.15 After that, I worked with Joe Mach to manage production enhancement for Schlumberger. Since then, Mach continued this work and was instrumental in Yukos’ achievements to increase production by 20% per year for several consecutive years without drilling new wells.
The only time my timing was bad was when I requested a transfer to Venezuela to start up a reservoir-modeling consulting group in time to see the oil price plummet in 1997. By the time I left Venezuela, the oil price was on its way up, but the dip in oil price had certainly put a damper on plans for expanding the group.
My best timing was meeting my husband of nearly 30 years, Michael Economides. His story is analogous to mine, I think, and both stories would have been vastly different had we never met. He is the reason I have had the courage and motivation to continue contributing to an industry that has never been all that eager to take women seriously, and I am the reason he became interested in petroleum engineering. Actually, our son played a role in all this as well, and I look forward to seeing Alex make his mark in the energy industry before long.
In recent years, I have been attracted back to academia. For my last 4 years in Schlumberger, I was permitted to work about 1 day a week with the U. of Houston, where I was appointed Director of the Petroleum Engineering Program. During that time, I became interested in the notion that petroleum engineers might be better educated with a broader scope, what I would call energy engineering. One reason is that our form of energy, oil, is misunderstood by most people, including many of us in the petroleum industry.
Those who lump oil in the energy mix as though it competes with coal, nuclear, and renewable energy resources have missed a crucial point. By and large, oil has only two purposes. In the U.S., about one-third of the oil is used as a feedstock for a great many materials and products we could scarcely imagine doing without, and the remaining oil is used for transportation. Further, 95% of the energy for transportation comes from oil. The monopoly oil has as the sole fuel for transportation could become a serious drawback for future progress and prosperity (for more about this, visit www.ceeti.org).
At the same time, our entire lifestyle and that of the developing world depends on energy. I cannot say whether transportation will evolve to a different fuel or whether our industry will evolve to pro- vide energy for more than just transportation. The energy business should ensure that the world has the affordable sustainable energy it needs without undue environmental impact. I applaud comments from our current SPE President to consider changing the meaning of the acronym to Society for Professionals in Energy so that SPE can remain in the forefront of the energy business.
References
- Ehlig-Economides, C.A., and Halepaska, J.C.: “A Numerical Study of Confined-Unconfined Aquifers Including Effects of Delayed Yield and Leakage,” Water Resources Research (December 1976) 12, 1,175.
- Agarwal, Ram G., Al-Hussainy, R., and Ramey, H.J. Jr.: “An Investigation of Wellbore Storage and Skin Effect in Unsteady Liquid Flow: I. Analytical Treatment,” SPEJ (September 1970), 291–297.
- Horner, D.R.: “Pressure Build-Up in Wells,” Proc., Third World Petroleum Congress, The Hague (1951) Sec. 11, 503–523.
- Tariq, Syed M., and Ramey, H.J. Jr.: “Drawdown Behavior of a Well With Storage and Skin Effect Communicating With Layers of Different Radii and Other Characteristics,” paper SPE 7453 presented at the 1978 SPE Annual Technical Conference and Exhibition, October 1–3, Houston.
- Sandal, H.M., et al.: “Interference Testing With Wellbore Storage and Skin Effect at the Produced Well,” paper SPE 7454 presented at the 1978 SPE Annual Technical Conference and Exhibition, October 1–3, Houston.
- Stehfest, H.: “Numerical Inversion of Laplace Transforms,”Communications of the ACM (January 1970), 13, No. 1, 47–79.
- Wagner, P.B., Economides, M.J., and Ehlig-Economides, C.A.: “Custom Type-Curve Generation for Pressure Transient Analysis of Elongated Linear Flow Systems,” La Revue de l’IFP, 39, No. 6 (November–December 1984).
- Bourdet, D., et al.: “A New Set of Type Curves Simplifies Well Test Analysis,” World Oil (1983) 95.
- Gringarten, A.C. et al.: “A Comparison Between Different Skin and Wellbore Storage Type Curves for Early-Time Transient Analysis,” paper SPE 8205 presented at the 1979 SPE Annual Technical Conference and Exhibition, Las Vegas, Nevada, 23–26 September.
- Moran, J.H., and Finklea, E.E.: “Theoretical Analysis of Pressure Phenomena Associated With the Wireline Formation Tester,” JPT (August 1962) 899–908.
- Kuchuk, F.J., and Ayestaran, L.: “Analysis of Simultaneously Measured Pressure and Sandface Flow Rate in Transient Well Testing,” paper SPE 12177, prepared for presentation at the 1983 SPE Annual Technical Conference and Exhibition, 5–8 October, San Francisco.
- Ehlig-Economides, C.A.: “Testing and Interpretation in Layered Reservoirs,” JPT (September 1987) 1,087.
- Ehlig-Economides, C.A.: “Use of the Pressure Derivative for Diagnosing Pressure-Transient Behavior,” JPT (October 1988) 1,280.
- Blasingame, T.A. et al.: “Decline Curve Analysis for Variable Pressure Drop/Variable Flowrate Systems,” paper SPE 21513, prepared for presentation at the 1991 SPE Gas Technology Symposium, 22–24 January, Houston.
- Ehlig-Economides, C.A., Mowat, G.R., and Corbett, C.: “Techniques for Multibranch Well Trajectory Design in the Context of a Three-Dimensional Reservoir Model,” paper SPE 35505 presented at the European 3D Reservoir Modeling Conference in Stavanger, 16–17 April 1996.

Ehlig-Economides has published more than 50 papers, has authored two patents, and has lectured or consulted in more than 30 countries. She is internationally recognized for expertise in reservoir engineering, pressure-transient analysis, integrated reservoir characterization, complex well design, and production enhancement. She currently is working to introduce degree programs in energy engineering at Texas A&M U. She recently became Director of the Center for Energy, Environment, and Transportation Innovation in the Crisman Inst.
Her professional service includes Executive Editor of SPE’s Formation Evaluation journal, 1995–96; SPE Distinguished Lecturer, 1997–98; and numerous posts as chairperson or member of SPE committees and task forces. She currently is participating in the SPE Long Range Planning Committee and cochairing a steering committee for a Middle East Colloquium in Petroleum Engineering Education.