
Introduction
In a multi-fatality incident report (IOGP 2023), a vehicle (double-cabin pickup) was carrying five occupants when the driver drove at a suspected 40 kph over the speed limit and lost control of the vehicle. It deviated from the road and collided with a 48-in. fire water pipeline next to the road. The vehicle then went through the gap underneath the fire water pipeline resulting in fatal injury to the driver and front passenger. Meanwhile, three passengers sitting in the back row sustained serious injuries. The investigation noted that the inherent causal factors of the incidents were fatigue-induced poor reaction and lack of supervision.
The unfortunate incident has similarities in causal factors compared to many land transport-related incidents over the past decades within the oil and gas industry. Inadequate hazard identification/risk assessment of fatigue and inadequate supervision dominated the list of incident causal factors followed by inadequacy in working standards/procedures, training/competence, and hazard identification/risk assessment which fall under people and process factors categories as shown in Fig. 1 and Fig. 2.


In addition to this, land–transport activity is also reported as the dominant contributor to the incidents which have the highest number of fatalities and LTI (Lost-Time-Injury)-to-Fatalities ratio. These findings underscore the urgency of targeted efforts based on prevention-centric strategies that focus on fortifying barriers and controls within the domains impacted by these dominant causal factors.
TAQA's Approach to Zero Fatalities
There are four main strategies for reducing the number of work-related motor vehicle fatalities.
1) Reduce the risk of injury by reducing the total amount of travel.
2) Substitute the means of travel (e.g., road vs. air) to reduce the level of risk to the worker.
3) Reduce the risks for necessary road travel.
4) Reduce crash severity, thereby reducing injury severity (SPE 168566).
Meanwhile, TAQA operations in KSA have substantially increased leading to a fivefold increase in the land-travel kilometers driven between 2022 and 2023. With vast terrain, varying environments, and logistical challenges such as airport availability, road infrastructure, and wellsite access, land transport remains the pragmatic option compared to the others. Therefore, looking through the lens of strategies to reduce the number of work-related motor vehicle fatalities—scaling back road travel or switching modes—becomes counterproductive amidst TAQA's rapid operations expansion.
These complications are pressing for the next level of prevention strategies to achieve TAQA HSE's core objective to prevent accidents and enable the employee to come home safely. In this case, reducing the risk of travel and reducing crash/incident severity (Nos. 3 and 4 in the above-listed strategies) are the main available strategies that TAQA has focused on to achieve its ultimate objective of reducing land-transport-associated risks.
Leveraging Data and Deep Learning To Build a Robust Engineered Journey Management System
The frontline of prevention in automotive-related incidents is the driver himself. Rigorous training of passengers, supervisors, and processes are influential elements in preventive controls. However, incident prevention starts from the driver’s seat. By utilizing a state-of-the-art In-Vehicle Monitoring System (IVMS), driving behaviors are measured and plotted on a framework called RAG (Red, Amber, Green) which characterizes the drivers based on their driving behaviors. Unsafe driving indicators such as harsh braking, harsh acceleration, and overspeeding are part of RAG calculation and are measured by the sensors in IVMS. Every occurrence represents in-vehicle feedback (alarm or buzzer). RAG will later categorize drivers into three color-coded categories signifying their behavior based on the accumulation of these indicators. Red is for unsafe drivers, amber is for drivers with at-risk behavior, and green is for drivers who demonstrate safe driving practices.
“Safe driving behavior” has a broad spectrum. For example, driving at 120 kph on a blacktop highway can be considered safe; however, driving at the same speed on a skid/rig road during the night is clearly classified as a risky driving practice.
TAQA Journey Management Center conducts in-depth study and enhances the RAG framework using a supervised deep-learning method and leveraging more than 3 million data points to gain important insight into drivers’ behavior. The result of the study quantifies the barometers of safe driving practices such as safe deceleration, safe cornering, safe speed, and others which later transformed into robust engineering control that enables drivers to self-correct their driving habits in real time.
Uncover the Hidden Tigers
A driver’s fatigue and failure to identify hazards/risks are evidently the perfect recipe for lack of judgment resulting in various automotive incidents—often due to the lack of a process to detect or correct challenges contributing to a driver's fatigue. To address these challenges, a versatile and interactive dashboard was developed in-house to uncover the trend of influential risks such as driving at night (low alertness), excessive driving hours, and RAG performance along with related parameters. The technology enables clear visibility and availability that aims to connect meaningful data between the Journey Management Center and operation leaders to take day-to-day immediate corrective actions and accelerate the risk-remediation process. Understanding and communicating the trends of these newly introduced indicators helped to significantly reduce the incident rate.
Digitalization With Purpose
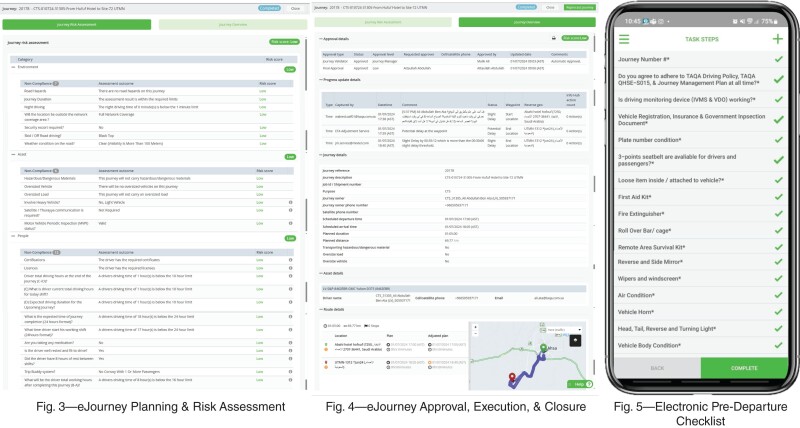
Inadequate work standards/procedures often result from inconsistent implementation on the ground. A complete digitalization of the e-journey process aims to align multiple roles to follow a consistent planning and risk assessment process, risk-based approval, execution, and escalation according to the work standard/procedure as shown in Fig. 3 and Fig. 4. As illustrated in Fig. 5, a mobile-based multi-language vehicle inspection app was utilized for both iOS/Android to eliminate language barriers, challenges in accessibility, and the use of paper.
In summary, the remarkable reduction in the automotive accident rate in 2023 and the sustainable improvement in driving performance throughout 2024 have been achieved by leaps and bounds, thanks to the advanced driving behavior evaluation method (RAG 2.0). This innovative method harnesses the power of deep learning to analyze vast amounts of driving behavior data and incorporates the analysis result in the IVMS program to enable a robust in-vehicle feedback system. It has allowed drivers to self-correct their behavior on the fly and adapt to external conditions, right from the driver's seat, leading to significant improvements in driving safety. The decreasing trend in unsafe driving events underscores the effectiveness and lasting impact of this data-driven engineering control.
Moreover, the availability of meaningful data such as Driving at Risk of Fatigue (DRF) and Driving at Low Alertness (DLA) at the fingertips of the Journey Management Center has accelerated the process of remediating risks through prompt and effective rectifying actions. The complete digitalization of this process has broken down language barriers, enabling all involved parties to align to a consistent journey management process spanning from risk assessment, risk-based approval levels, and execution, to escalation. By getting everyone on the same page, digitalization allows every journey to be managed with a keen eye on safety and efficiency, paving the way for a sustainable and safer driving environment.
References
SPE 168566 (2014) Journey Management: A Strategic Approach to Reducing Your Workers’ Greatest Risk by K. Retzer, CDC NIOSH; D. Tate, Derek Tate Consulting; and Ryan Hill,
CDC NIOSH.
Report 2022mfh. Fatal Incident and High Potential Event Reports—Land Transportation Activity, page 6. August 2023. International Association of Oil & Gas Producers (IOGP).
Report 2022s. IOGP Safety Performance Indicators, page 45, Table 21. June 2023. International Association of Oil & Gas Producers (IOGP).