

This work presents a methodology to construct a sector model for the Tengiz field that covers one-sixth of the field area to evaluate improved-/enhanced-oil-recovery (IOR/EOR) processes to increase oil recovery through the life of the field. The method takes into account boundary flux, edge wells, and compositional effects to replicate full-field-model performance and subsequently generate alternative predictions. This model matches production/injection data of existing wells and the anticipated performance of future wells in the full-field model.
Introduction
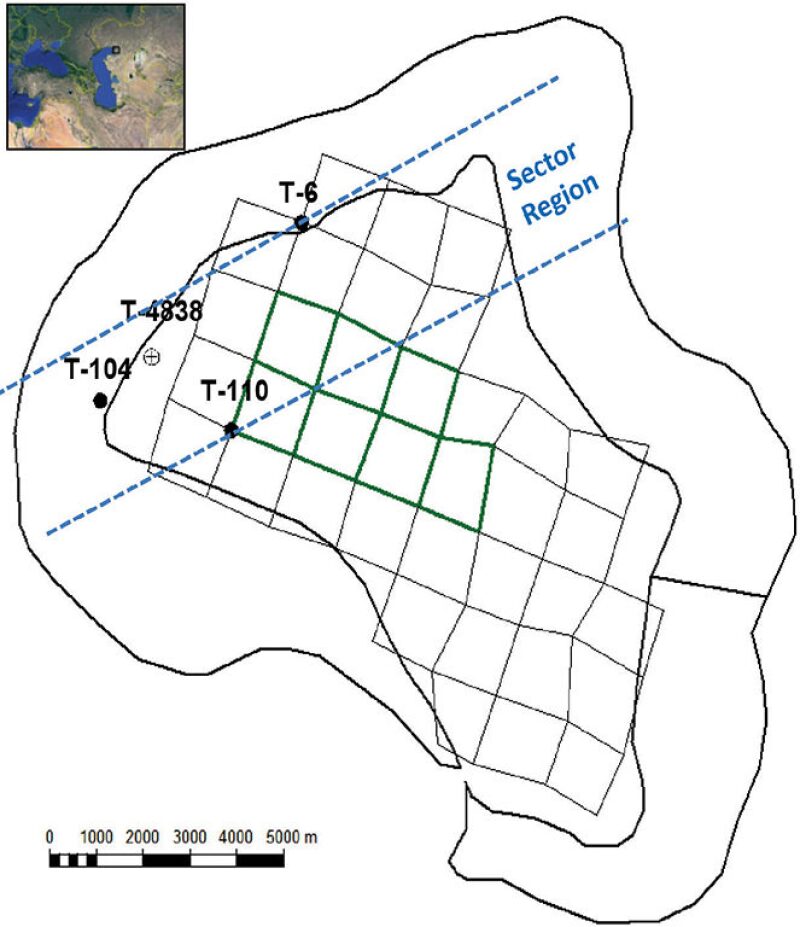
The Tengiz field is a giant carbonate oil field onshore western Kazakhstan at the northern end of the Caspian Sea’s eastern shoreline. Tengiz is a stratigraphic trap consisting of a carbonate buildup with a large central platform area (10×15 km) with a raised rim area (up to 2 km wide). The Tengiz reservoir has mesa-like geometry overall—flat topped and steep sided. The top of the platform has a slight regional tilt (less than 1° to the south). The sides of the platform generally dip approximately 25° on all flanks.
Production has been mainly from primary pressure depletion through oil expansion. Sour-gas injection was implemented in 2007 to address pressure decline and improve recovery efficiency. In general, the platform lacks fractures and is best suited for gas injection, whereas the slope is suitable for depletion drive because of high fracture density. Because gas injection is limited to the platform region, the main objective of this study is to investigate the best pressure-maintenance or IOR/EOR method to apply to the fractured slope region.
Sector Model
The area of the field modeled with the sector model was selected to include geological regions, material-balance regions, and displacement processes that are representative of Tengiz as a whole. The model incorporates 15.2% of the field surface area and has platform and slope regions within its boundary. Fig. 1 shows that the sector model includes (a) two five-spot existing sour-gas-injection patterns (green-line-pattern area) and (b) seven future-growth-project and sour-gas-injection patterns in the central platform region (black-line-pattern area). This sector model has 127 wells divided into two groups. The first group has 62 future and existing producers and eight injectors associated with base business operations. The second group has 57 potential future infill wells for long-term IOR/EOR development plans.
The sector model does not have a natural boundary around its outer surfaces because it represents a section of the reservoir carved out of the full-field model. Fluid migration across the sector boundary occurs during the entire production and injection period. “Phantom” wells are included in the model to account for mass transfer between the sector model and the rest of the reservoir. Fig. 2 above shows the location of the phantom wells along the perimeter of sector model. Flux across the boundary was modeled by injecting gas with the oil composition into the phantom wells. This technique enabled estimating flux across the boundaries and accommodated the phase behavior at reservoir conditions with the compositional formulation. The boundary flux was calculated from the start of full-field production through 2033. In this study, the boundary flux was adjusted on an annual or semiannual basis during history- and future-matching periods.
Methodology for History and Future Matching
The sector model was history matched before being used to forecast production.
The history matching consisted of two parts. The first part was a conventional approach, matching known production history. The second part was called “future matching,” in which the sector model matched the future performance of the corresponding wells in the full-field model.
Matching of Known Production History. Oil-production rate (OPR), gas/oil ratio (GOR), gas-injection rate (GIR), and flowing bottomhole pressure (FBHP) of existing wells, together with regional reservoir pressure, were matched from 1 January 1991 to 1 January 2011.
Matching of Future Performance. The future-matching period was from 1 January 2011 to 1 April 2033. During this time, the sector model matched the performance of existing and future wells from the full-field forecast. The parameters matched were OPR, GOR, GIR, FBHP, and reservoir pressure.
Edge Wells. The procedure to manage the edge wells during the future matching was as follows:
- All edge wells are treated as half-wells with 50% of actual rates and corner wells at 25% of actual rates during history matching.
- During future matching (benchmarking with the full-field model), the production rates of all edge wells were not reduced but remained the same as in the full-field model. Instead, they were assigned a well-efficiency factor (WEFAC) of 50% of corresponding wells designed for future-growth projects in a full-field model. The WEFAC represents the percentage of online time of any well in the reservoir model. For instance, if a specific well in the full-field model has an 80% WEFAC, then the same well would have a 40% WEFAC if it is located on or near the edge of the sector model.
- Preserve the same production or field-management rules as used in full-field model.
- Use total production rates from the same well group in the full-field model to guide the sector-model rate constraint during history and future-performance matching.
- Fluid migration across the boundary was modeled by injecting gas with the oil composition through phantom wells because directly injecting oil is incompatible with the equation-of-state compositional model.
- The fluid-migration rate was estimated from the flux across the intermaterial-balance-region boundary reported in full-field-simulation output. The calculation of boundary flux was started from the beginning of history matching.
Using the concept of WEFAC allows the same flow tables to be used in the full-field model and the sector model.
Results of History and Future Matching
The technique of injecting gas with the oil composition worked well during the history matching and future matching because it did not introduce extra free-gas saturation. A comparison of gas saturation between the sector model and full-field model of the same sector region at 1 January 2033 shows the gas-saturation profiles to be nearly identical in the matrix and fracture cells, and no free gas was found at the phantom-well locations.
A comparison of history and future matching for reservoir pressure, OPR, and GOR at field level shows very good agreement between sector and full-field models.
IOR/EOR Study
IOR or EOR processes to improve long-term oil recovery further are investigated in this study. The injectants include nitrogen (N2), carbon dioxide (CO2), sour gas, and water. The injectors are located in either the upper- or lower-slope regions of Tengiz field, depending on the density contrast between the injectant and the oil at reservoir conditions, to take advantage of gravity effects.
The injection rate is based on the water-injection rate required to achieve 100% voidage replacement. The initial design includes seven injectors for every scenario. A water-injection rate of 40,000 B/D per injector was required to maintain the voidage-replacement ratio (VRR) at unity for waterflooding. All water injectors are located in the rim or slope region. Gas-injection rates of 54, 72, and 84 MMscf/D per well for N2, sour gas, and CO2, respectively, were required to achieve a VRR of unity for the other scenarios.
Results
Simulation results are organized into two groups. The first group has results for sour-gas and N2 injection, and the second group has results for CO2 and water injection. The injection is analyzed by comparing the distributions of gas saturation and injectant concentration in the fracture and matrix grids (simulation grids or cells). The key component for N2 and CO2 injection is either N2 or CO2, respectively, because the seven-component fluid characterization used in this study includes these as pure components. The injected sour gas has a higher hydrogen sulfide (H2S) concentration than the original oil. Hence, H2S concentration in the oil or gas phase is used to monitor the progress of sour-gas injection in the model.
Analysis shows that gas saturation occurs at the upslope region with N2 or sour-gas injection because the injectant density is lower than the oil density at reservoir conditions. The injected N2 and H2S preferentially remain in the fractures with little penetration into the matrix because of a fracture permeability much higher than matrix permeability.
The injected CO2 preferentially remains in the fractures with little penetration into the matrix, similar to what is found with N2 injection. However, CO2 moves much farther down into the slope region than N2 does because of a higher density contrast with the oil than that of N2 at reservoir conditions. CO2 behaves like a liquid or a supercritical fluid at reservoir conditions because of its low critical temperature (87.8°F) and low critical pressure (1,070.4 psi). Hence, CO2 is heavier than Tengiz oil at reservoir conditions. Additional simulation runs were conducted to investigate the merit of placing CO2 injection either up- or downslope. Downslope CO2injection yields higher oil recovery than upslope CO2 injection. The injected water stays mainly in the fracture in the lower-slope region, with slight imbibition into the matrix.
Water maintains a VRR of unity. The VRR of the gaseous injectants ranges from 92 to 94%. The difficulty for gas injection to achieve a VRR of unity is a result of gas breakthrough in the fractures.
Conclusions
The methods presented in this study are robust and can be used to simulate sector models for most reservoirs. The conclusions from this study include
- The methodology eliminates the need to generate new flow tables for partial wells near the boundary or a corner of the sector model.
- Injecting gas with the oil composition was demonstrated to overcome the difficulty of maintaining the boundary conditions in a fully compositional model.
- Matching the predicted FBHP of future infill wells from a full-field model in the sector model increases its credibility further.
The main disadvantage of this method is the treatment of boundary flux, which must be calculated from the full-field model over the history-matching and future-matching periods. Whenever the sector region is changed, the whole process needs to be repeated. Therefore, it is important to select a sector region carefully before beginning the study, to avoid duplicating efforts.
This article, written by Special Publications Editor Adam Wilson, contains highlights of paper SPE 170605, “A Sector Model for IOR/EOR Process Evaluation,” by Shie-Way Wang, Batima Yeskaiyr, SPE, and Chuck Walker, Tengizchevroil, prepared for the 2014 SPE Annual Technical Conference and Exhibition, Amsterdam, 27–29 October. The paper has not been peer reviewed.