

The 2021 SPE Membership Salary Survey offers more than insights into oil and gas salaries. This year’s report explores benefits employers are offering by region, job level, engineering title, and comparisons of pay changes by types of engineers.
This year, 2,241 SPE members completed the survey, yielding a 5.8% response rate. From that total, 1,745 responses provided full-time employment compensation data, leading to a 4.5% final response rate with a margin of error of ±1.96% at a 95% confidence level.
Nearly 900 engineers participated in the survey, a 26% increase from last year.
Participants in the survey represented 89 countries and 33 states in the US. On average, respondents in North America were 45 years old, 44 in Europe, and 36 in Africa and Russia and Caspian. Male respondents averaged 43 years old; females averaged 40. The percentage of female participants included in the report (12%) was the lowest of the past 5 years (15% in 2020 and 14% from 2016 to 2019).
Respondents provided the employment status that described them for the majority of 30 June 2020 to 30 June 2021. Almost all full-time respondents were employed at a company (93%), 4% were consultants, and the remaining 3% reported as independent contractors, freelance, self-employed, or business owners.
General Findings
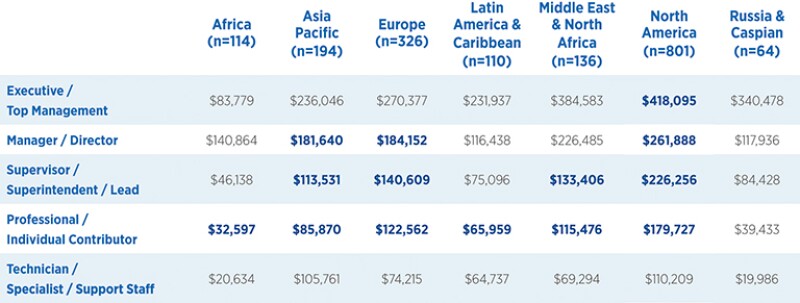
Oil and gas professionals working in Africa, Asia Pacific, Latin American and the Caribbean reported lower base and bonus pay this year compared to 2020, while professionals in Europe, North America, and Russia and Caspian reported pay increases (Fig. 1).
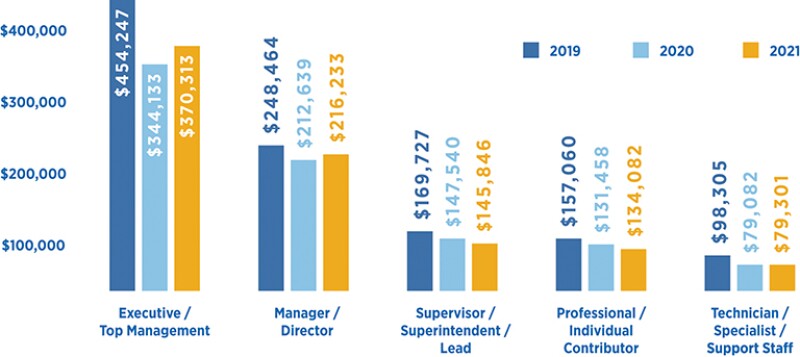
Among job levels, Executives and Top Management reaped the highest increase in pay, earning 8% more on average than last year, but this increase is still well below pre-pandemic levels. Managers and Directors reported a small increase of 1.7% on average when compared to total compensation in 2020. Professionals and Individual Contributors over the past year also earned 2% more in total compensation than last year. Supervisors/Superintendents/Leads reported earning 1.15% less in total compensation while Technician/Specialist/Support Staff reported the same total compensation as in 2020 (Fig. 2).
Insights Into Engineers’ Employment
Engineers reported an overall average base salary of $118,996 with $27,866 in bonus pay, totaling $146,861. The average survey respondent reported receiving 21 days of paid time off, 12 days of sick leave, and nine paid holidays annually.
Among engineers in oil and gas, the highest average total compensation was reported for Civil Engineers at $158,667, with Reservoir Engineers ($132,402) and Completions Engineers ($130,681) the second and third highest. Reservoir Engineers, again, are the top-earning engineers in terms of base salary with an average of $132,402. They earned 3% more base salary on average this year than last year. The lowest average total earnings were reported for Health/Safety/Environment Engineers ($80,141), Electrical Engineers ($81,340), and Mechanical Engineers ($83,705).
Survey respondents were asked to report on a range of benefits so analysis could be conducted by region, job level, and engineering title. These benefits were categorized into four main categories: compensation benefits, insurance benefits, general benefits, and general work benefits. The most common benefit is health insurance for 81% of respondents, while the least common benefit was company-provided childcare at 6%.
Learn More
SPE produces this annual salary survey to provide a reference for compensation in the oil and gas industry. The report is based on a sample of self-reported information from petroleum industry professionals.
For a more thorough analysis, SPE produces the 2021 SPE Salary Survey Full Report, which provides an in-depth look at oil and gas compensation and benefits, including specifics on the multiple engineer job titles captured in the survey. SPE also produces a full data file in Excel that includes all data used for reporting. These data are anonymous to protect the identities of the respondent. The in-depth data allow individuals to conduct their own analyses of the reported data.
The survey data and reports are available for purchase. Use your SPE member login for a member-exclusive discount of 50%. New data and report packages are available with member discounts for the purchase of individual items.
Inquiries regarding the survey and suggestions for questions for next year’s survey may be addressed to speresearch@spe.org.