Petroleum industry professionals reported an average total compensation of USD 206,020 in 2015, down from 2014 (USD 214,328) but similar to compensation reported in 2013 (USD 203,557).
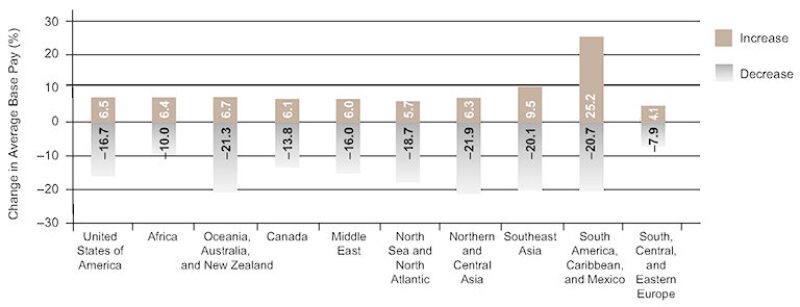
Although the reported compensation in 2015 was lower than in 2014, more than half (58.5%) of this year’s respondents indicated that their base pay increased over the past year. However, that was a significantly smaller percentage than the 82.2% respondents who reported an increase from 2013 to 2014. Those who experienced a gain in base pay saw their pay increase by an average of 8% over the past year. For respondents whose base pay decreased, the decline was by an average of 18.4% from last year.
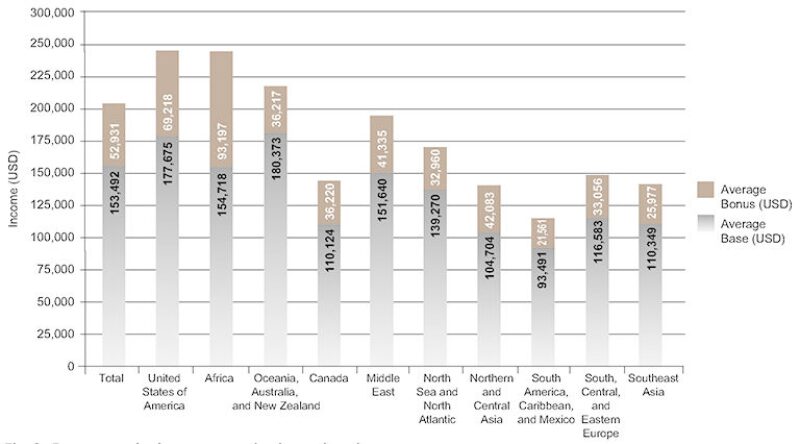
The mean base pay reported in 2015 (USD 153,492) was down from 2014 (USD 156,439) and was similar to 2013 (USD 153,620). Other compensation (including bonuses) has been declining since 2013. This year, members reported an average of USD 52,931 in other compensation; last year, the average was USD 57,889 (Table 1).
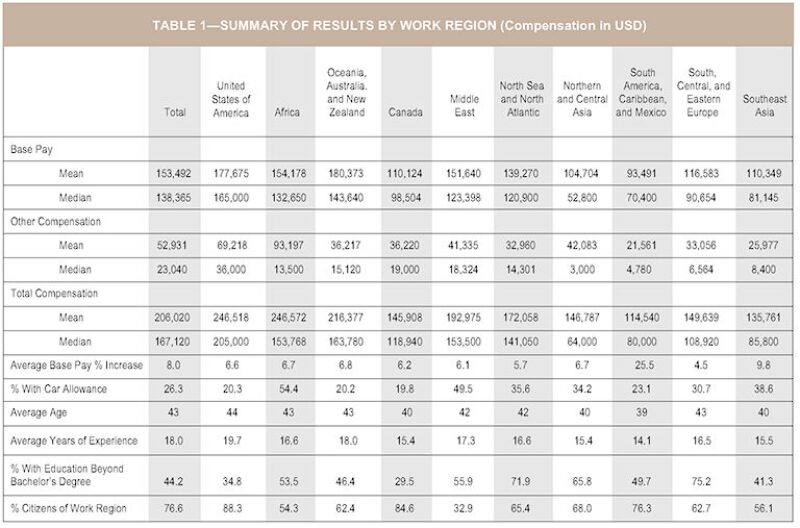
The number of professionals who received a car allowance has also declined. One-fourth (26.3%) of the respondents received a car allowance, which declined from 28.4% in 2014 and 31% in 2013.
The average age of energy and petroleum professionals participating in the survey was 43, similar to previous salary surveys. However, the average age of male and female participants was 44 and 37, respectively. The number of years of experience in the industry remained consistent this year as with previous years, with an average of 18 years.
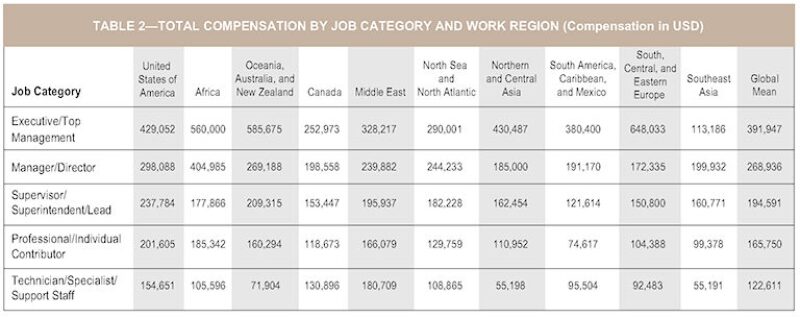
Total Compensation by Job Category, Work Region
The mean total compensation among the top tier of professionals declined from 2014, but this was not seen across all regions (Table 2). The most marked declines are from the United States, Canada, and the North Sea and North Atlantic regions. Other categories of professionals were able to maintain their level of compensation.
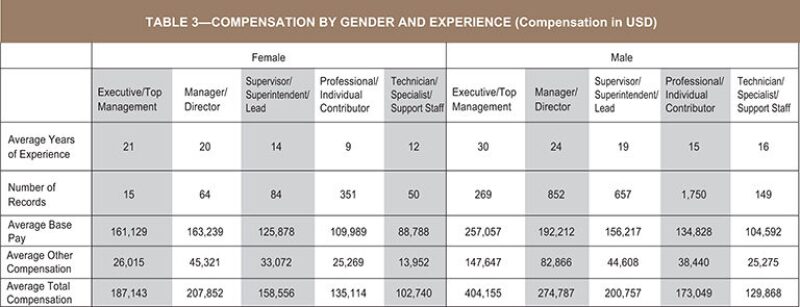
Compensation by Gender
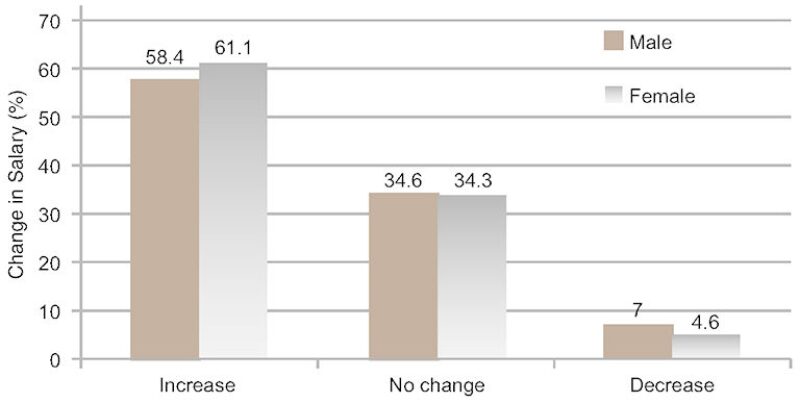
The majority of professionals of both genders gained an increase in their salary since last year (Table 3 and Fig 1). However, the number of respondents reporting an increase has declined significantly since 2014 (81.2% in 2014 compared with 58.4% in 2015 among male respondents). Those reporting no change or a decrease has risen, with 7% of males reporting a decrease compared with only 1.7% in 2014, while those reporting no change has risen from 17.1% in 2014 to 34.6% in 2015. Female professionals were more likely to experience a positive salary growth than their male counterparts and were also less likely to experience a decrease.
Base Pay by Region
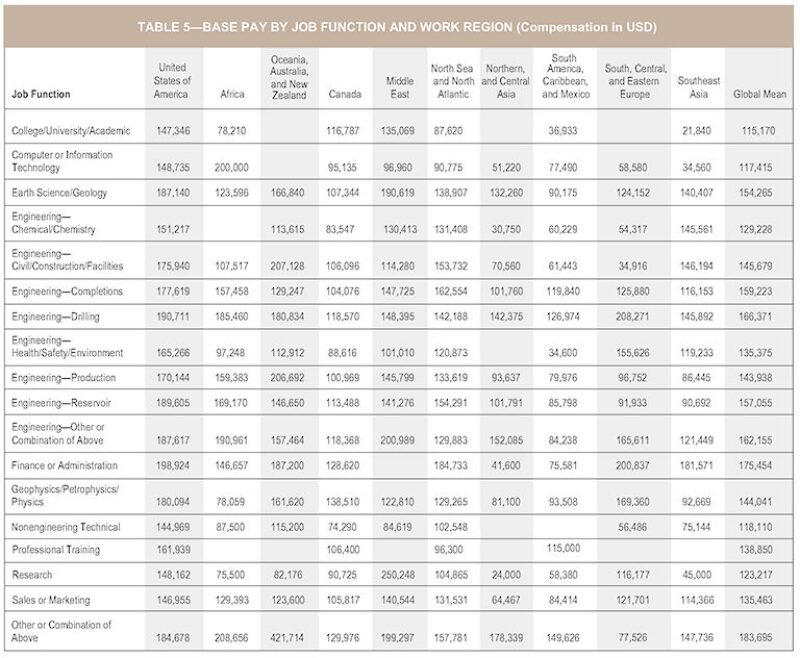
The South America, Caribbean, and Mexico region received the largest percentage increase of any region; besides that region, salary increases hovered around 6% (Tables 4 and 5, and Figs. 2 and 3). The region of Northern and Central Asia showed both the largest percentage of respondents who received a decrease in their base pay (22.7%) and the largest reduction in base pay (21.9%).

To Learn More
This report represents a sample of current compensation in the industry. A detailed summary report containing charts and descriptive statistics of trends and more information on the jobs, geographies, and employer types will be available from the SPE Bookstore at store.spe.org/ in early November.
About the Survey
In July, SPE sent invitations to 89,102 professional members to participate in the annual SPE Membership Salary Survey by completing an online survey. The survey drew 5,553 responses, of which 4,340 provided valid compensation data. Salary information and other data in the report were entirely self-reported.
Participants in the survey are based in 87 countries and 77.2% are citizens of the countries in which they work. The majority (95.6%) of respondents indicated that they are full-time payroll employees. About 2.4% are contract, freelance, or part-time employees, and about 1.7% are self-employed or business owners.
One-fifth (20.2%) of participants in this year’s survey are primarily engaged in reservoir engineering, while 11.2% specialize in production and operations, and another 10.9% are involved in drilling. Nearly one-third (31.3%) of respondents work for an independent oil and gas company. About one-fourth (26.7%) are employed by a service or manufacturing company, one-fifth (20.6%) are employed by an integrated oil and gas company, and 8.3% work for a national oil and gas company.
All compensation data presented are expressed in US dollars (USD). Data collected in local currencies have been converted to USD at the exchange rate on 26 August, the effective date of this year’s data.

