The trend in fracturing designs has been longer stages with more perforation clusters, which save time and money.
Based on papers at this year’s SPE Hydraulic Fracturing Technology Conference and Exhibition, the thinking that has sharply reduced the number of perforations per cluster and improved the effectiveness of fracturing is becoming the industry norm.
But there are a couple of companies questioning the consensus by fracturing wells with shorter stages and fewer clusters to see if they deliver more oil and gas production.
ConocoPhillips has been considering “going backward to fewer clusters per stage,” said Dave Cramer, a senior engineering fellow at the company.
“In some areas, we are testing out fewer clusters per stage based on fiber-based observations in offset wells that (indicate) far‑field treatment uniformity is improved as a result,” he said, adding “another advantage of reducing stage length is that injection rate into the hydraulic fractures is increased, which leads to increased fracture width and improved proppant transport.”
The offset-well observations mentioned were in a recent paper by Devon Energy that reported on a test which concluded that stages with fewer clusters were more efficiently fractured than longer stages with more of them (SPE 212340).
The 36-page paper was based on extensive testing at Phase 3 of the Hydraulic Fracturing Test Site 1 in the Eagle Ford, where a well fractured using a wide range of clusters per stage was used to find a way to most effectively refracture productive rock missed by an old fracture design.
The data were shared with companies backing the private-public partnership with the US Department of Energy, which included ConocoPhillips.
The paper’s authors wrote, “Generally, cluster efficiencies are higher for stage designs with fewer clusters.”
Cluster efficiency depends on the entry holes in a cluster getting enough fluid at a high enough rate to create a productive fracture. Fracture length is the result of other choices, including the pump rate, the entry-hole numbers, diameter, and placement.
The thinking behind these designs—as with most fracturing nowadays—is based on the limited‑entry method. This technique ensures the pumping rate and fluid volumes are enough to properly stimulate all the perforations, which are sized and placed to ensure all the entry holes have a chance of developing a fracture.
The industry’s focus on equalizing treatment goes back to early studies using fiber optics that revealed that the first clusters passed nearest the heel side of the lateral were taking in the lion’s share of the fluid and developing dominant fractures, leaving many later clusters under stimulated.
Based on recent papers from Devon and Hess, limited-entry ensures most clusters are stimulated, but dominant clusters are still getting more than their share because the high flow rates that favor them with more fluid also ensure they erode faster, allowing them to take in more fluid.
“Regardless of intended design, the stimulation is making a similarly sized dominant fracture and is taking a similar amount of fluid,” the Devon paper said. That means the fluid flow remaining for later stages is roughly similar, whether there are 10 more clusters to stimulate or 20 of them.
Based on Devon’s test well results, fracturing efficiency declined as the number of clusters per stage rose. Some loss of efficiency is an acceptable tradeoff, given the higher cost of fracturing more stages. But the data suggests there’s a limit.
“The total (pumping) rate is not enough to fracture all 22 perfs. That limits what you can get out of those toe clusters,” said Jackson Haffener, a geophysicist for Devon, when delivering a presentation about the paper at the SPE Oklahoma City Oil and Gas Symposium.
At the symposium, Haffener said that with new, shorter stage designs, “We are now leaving less resource behind with lower cluster counts.”
Cramer said the production gains from shorter stages with fewer clusters are expected to be “meaningful.”
“We are always trying to reduce costs,” but “we may need to pay a little more to make the most profit,” he added.
Why Do That?
Those encouraging words fail to answer the obvious question for a completion engineer thinking about trying shorter stages with fewer clusters: How much more can a shorter stage produce?
The quotes above suggest shorter stages can deliver more oil and gas. But based on what has been disclosed, there’s little public information on whether going shorter can add the production needed to justify the cost of fracturing more stages. And that has become critical as public companies expand their share of major share plays.
“If they spend more money, there is a big push to know why,” said Justin Mayorga, vice president, shale supply chain research at Rystad.
The areas where companies are willing to spend more are proven ways to increase production; for example, companies are pumping more sand—with averages in the Permian rising from 2,200 pounds per ft to 2,500, he said. He added that reflects the rebound in sand production, which has brought prices down to affordable levels.
Companies are also spending more for extremely high-horsepower pumps—which can more efficiently deliver the pumping rate needed to effectively fracture multiple wells—and phasing out diesel-powered pumps in favor of ones running on lower-cost natural gas, Mayorga said.
And they are spending more on rounds of diagnostic testing and analysis to figure out the most-productive options when engineering wells.
A good example of that is the process Hess used to prove the ideas that went into its current design standard, described in a paper where the title called its new cluster design a “one-shot wonder” (SPE 212358).
It was an eye grabbing headline for an SPE report on field testing which supported the value of one-shot clusters. But upon further consideration, Hess’s team worried that readers could associate that phrase with songs that are “one-hit wonders,” which are the opposite of its systematic long-term performance improvement program.
The paper described the extensive diagnostic testing and analysis done before Hess changed its Bakken fracturing methods. Changes included reducing the number of holes per cluster from three to one and a commitment to extreme limited‑entry design, with perforations that push the entry-hole level to a friction pressure of 2,000 psi.
Longer stages reduced the number needed per well by 12 and cut completion costs by more than 10%, said Ohm (Apiwat) Lorwongngam, a completions engineering advisor at Hess.
The limited-entry thinking behind Hess’s paper is consistent with the Devon paper on many points. Both endorsed extreme limited-entry designs and identified issues with high numbers of clusters per stage.
The Hess paper included a chart showing there was a significant loss in fracturing uniformity as the number of clusters neared 20, and the results deteriorated from there (Fig. 1).
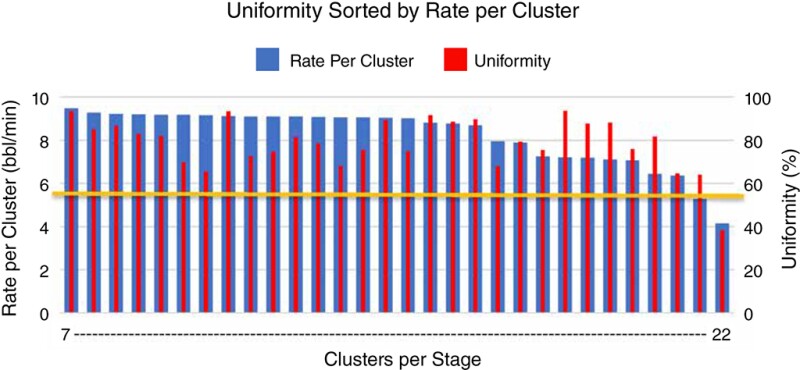
Lorwongngam said the limit on the number of one-hole clusters is based on the number of bbl/min that can be delivered to each hole, with 4.5 being about the minimum.
“We found that we can increase the total clusters in a stage up to 20 while keeping high limited-entry pressure and keep rate per cluster above 5.0 bbl/min. We have tested up to 24 clusters per well to understand the upper boundary,” he said.
Hess’s current design tops off at around 18 clusters for stages located near the heel of the lateral, where it can deliver the high flow rate needed to treat all those holes. But stages near the end (toe) of the laterals have about half as many clusters to compensate for the lower pump rate that results from the friction encountered on laterals that are typically 2 miles long.
The one-shot design will also allow Hess to increase well production by adding more single-shot clusters for closer spacing if oil prices go up and stay up.
The paper said the design would save money by reducing stage counts without sacrificing production. Based on 2 years of using the design, “Hess production numbers per wells have exceeded our internal expectations,” Lorwongngam said.
And Hess is continually looking for ways to improve. Lorwongngam said Hess is now doing field tests using fiber-optic strain measures to measure fracture growth and is considering how to evaluate whether its proppant is being effectively distributed.
Now Consider This
Over time, engineers are getting a better feel for the impact of variables and how they interact.
“There are a lot of different tricks you can play” by adjusting variables ranging from the cluster design and the proppant pumped per perforation to the pumping rate and friction pressure, Cramer said. “You have got tradeoffs on all this stuff. I want to emphasize that point.”
A big reason Devon’s fracturing evaluations diverge from the common wisdom is the operator gathered data on fracture growth using a new method it developed.
At the Eagle Ford test site, Devon used fiber optics in an observation well 225 ft from a well that was being refractured. The strain measurement showed where each fracture grew. That data plus in-well imaging, which measured how much entry holes grew during pressure pumping, was used to measure fracture efficiency.
They observed that the 22-cluster stage produced the largest number of long fractures, but those four fractures represented only about 18% of the long fractures measured by the observation well. The 7-cluster stage outperformed it with an average of 2.5 long fractures—a 35% rate.
When they analyzed the data, the 7-cluster stages with high perforation friction had 100% cluster efficiency. The 22-cluster stages were the lowest, at 78%, with the 12-cluster stages in between.
In the stages with the highest cluster counts, the paper observed that all the dominant fractures grew out of the heel side of the stage, suggesting those on the toe side were poorly stimulated.
“The implication from this observation is high cluster count designs are understimulating the less-dominant clusters, corroborating the perforation imaging results,” the Devon paper said.
Cramer added a counterintuitive argument for shorter stages based on sand distribution. His thinking is that the dominant clusters that take in the most fluid do not always take in as much sand. In those cases, production from the big fracture is likely to be undercut by poor propping over time.
The one-word explanation for the disparity is inertia. The high flow rate as slurry reaches the first perforations pushes fluid into the entry hole while a lesser share of the heavier sand grains goes in there. The inertia of the heavier sand particles means much of it ends up in entry holes near the toe end of the well where the flow rate is lower, Cramer said.
That logical-sounding possibility has been talked about for years, but there was no test that was sufficiently realistic to convince engineers to drop their assumption that fluid and sand outflow is roughly equal, or to support the creation of more realistic sand distribution formulas.
Cramer had his doubts as well, but his thinking began to change when an engineer at ConocoPhillips in Canada who was concerned with higher-than-expected treating pressure decided to try changing the cluster design to see if that reduced it.
He was hoping to balance the sand distribution by going from two to three holes in a row on the high side of the casing and address other possible explanations for those higher pressure readings, Cramer said. The results were promising, and the post-well diagnostics indicated much better proppant distribution, but there’s been no paper offering specifics.
There is a cost to adding more holes per cluster. Bigger clusters increase the amount of fluid needed per stage to ensure that all those holes are stimulated. Typically the solution is to reduce the number of clusters, resulting in a shorter stage.
The closest anyone has ever come to a realistic test of sand outflows was reported in a paper by GEODynamics last year using a full-sized stage model that allowed surface measurements of the flow of the water and sand (SPE 209178).
Its results from tests with 8- and 13-cluster configurations ran counter to the assumption that the cluster taking in the most water would always be taking in the largest amount of sand, said Steve Baumgartner, senior engineering technical advisor at GEODynamics, who played a key role in the surface test.
“More 40/70-mesh sand ends up in the toe-side clusters than in the heel-side clusters,” he said (Fig. 2). Their testing showed that is not the case with the smaller particles in 100-mesh sand which “stay with the fluid and are able to turn the corner in all clusters from heel to toe side.”
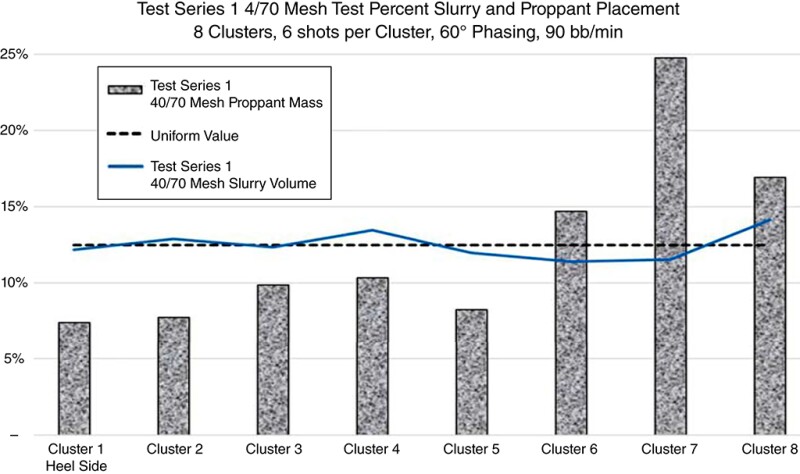
When they measured the fluid and sand collected after testing, they found 100-mesh sand was more likely to go out uniformly in all the clusters, he said.
Stage Penalty Shrinks
As the industry has shifted to longer stages, the cost/benefit of doing so has shrunk as the transition time between stages while fracturing goes down.
Zipper fracs that switch back and forth from one well to the next have allowed one well to be pumped while a wireline crew perforates the next stage on the second well that is being fractured as part of that back-and-forth pattern.
Simul-fracs allow multiple stages to be fractured at once, which is driving demand for extremely large pumps, Mayorga said.
The average time between stages has dropped from 45 minutes a decade ago to 25 minutes or less now, and service companies, including SLB, are developing automated pumping and wireline management systems that promise further reductions.
Improved hardware and increasingly automated control systems have also reduced switching times, but the industry is far from the goal of pumping 24/7.
The average job today is pumping approximately 16 hours a day, according to Tim Marvel, vice president for business development and technology at SEF Energy. The company’s holdings include Downing, which is developing an automated completion system, reducing the time between stages with the goal of fracturing 24/7.
“Every day we come in and look at the white space between stages as shown on a time-based activity chart and see how much we can eliminate,” he said.
Marvel said their automation system currently allows users to pump an average of 20 hours per day. It does that with features that reduce the transition time between stages, allow continuous pumping during transitions, and automate wireline operations. The machinery includes a unit that applies just the right amount of grease to valves after each use.
Marvel’s job also requires finding a way to convince operators to pay up to use an automated system and adapt their operations for that change. During a presentation at the OKC Symposium, he suggested a shift to shorter stages could offer an opening.
“If there is no time penalty between stages, would you go to shorter stages?” Marvel asked at the symposium (SPE 213101).
If they were able to pump nearly 24 hours a day, Lorwongngam agreed that the number of stages in the well would have less effect on the overall cost. But he said the cost of wireline runs and perforation guns per stage would still need to be considered.
Even with all that automation, there’s still an average of 4 hours a day of downtime, much of which is spent replacing pumps battered by pumping all that water and sand.
Marvel agrees that downtime for repairs remains a major cost item and a barrier to 24/7 operations. In his presentation, he reported on successful wellsite demonstrations of the company’s robotic system that can safely remove a broken pump and replace it with a new one with no humans required in the red zone while fracturing continues.
“Automated pump swapping allows you to do maintenance without stopping pad operations,” Marvel said. In the past they have demonstrated what they can do on a pump or two.
“The first commercial fleet to be deployed on the majority of the frac pumps will be deployed in July/August time frame,” he said.
By his accounting, the system can reduce the time between stages to 30 seconds, adding hours of pumping time per day and keeping workers out of dangerous places.
“The pumping slows a bit; we do not stop. We transition the zipper and start back up,” said Marvel, who said the change is “nearly instantaneous.”
To Change Out a Pump
- The pump is isolated, the pressure is bled down, and the pump is uncoupled.
- The pump truck is moved out for repairs or replacement.
- Another pump truck is backed into that position.
- Actuated arms couple the automated pump-swapping skid with a plate mounted to the back of the truck, and the plates are clamped together.
- The connection is pressure tested, the pump is pressure equalized, and opened to the missile and brought back online.
Source: SPE 213101.
For Further Reading
SPE 212340 Redefining Recoverable Reserves in the Eagle Ford: Refracs and Infill Development Lessons Learned From the Hydraulic Fracturing Test Site 1 (HFTS) Phase 3 by K. Brinkley, C. Thompson, and J. Haffener, Devon Energy, et al.
SPE 212358 One Shot Wonder XLE Design: A Continuous Improvement Case Study of Developing XLE Design in the Bakken by A.O. Lorwongngam, M. McKimmy, and E. Oughton, et al., Hess Corp.
SPE 213101 Automated Completion Surface System: The Path to Fracturing 24/7 by T. Marvel, SEF Energy; A. Johnson, Downing; P. Douget and Michael Mast, Blue Ox Resources, et al.
SPE 209141 Execution and Learnings From the First Two Surface Tests Replicating Unconventional Fracturing and Proppant Transport by P. Snider and S. Baumgartner, GEODynamics Inc.; and M. Mayerhofer, Liberty Oilfield Services, et al.
SPE 209178 Modeling Proppant Transport in Casing and Perforations Based on Proppant Transport Surface Tests by J. Kolle, Oil States Energy Services; A. Mueller, ACMS LLC; and S. Baumgartner, GEODynamics, et al.