Shale producers have long sought to understand how fractures propagate underground, a fundamental question that shapes well spacing, completion strategies, and overall economics.
A new study from Devon Energy (SPE 223547) aims to provide answers.
It introduces the concept of fracture growth rate, which can “vary drastically” between formations, and examines the key geological and geomechanical factors driving those differences. Devon defines fracture growth rate by the area increased per the volume injected (ft2/bbl) to create the fracture.
“We noticed that the Eagle Ford has much slower growth rates than in the Anadarko, and it could be up to a four- or five-times difference,” said Brendan Elliott, subsurface engineering manager at Devon Energy, speaking at the SPE Hydraulic Fracturing Technology Conference and Exhibition (HFTC) in Houston.
According to the Oklahoma City-based firm, the variations in growth rate observed across thousands of fracture stages not only impact per‑well economics but also dictate how many wells an operator can drill per section.
“If you think about a barrel injected as a proxy for volume or frac size, in some areas of the world, you’re getting much less area per barrel,” Elliott said. “That’s important to understand, especially as we contextualize the differences across our plays.”
He then presented data comparing fracture growth rates across Devon’s operating areas, emphasizing a key trend: “If you look at the plays with some of the fastest growth rates, those tend to be the ones with the least dense well spacing.”
Elliott pointed to the Turner Sands formation in Wyoming’s Powder River Basin, where most 640‑acre drilling sections today support only two to three wells. By comparison, in the Eagle Ford Shale, well spacing of 330 ft often allows for as many as 14 wells per section.
Devon’s findings are the result of more than 5 years of diagnostic work using its proprietary technology, sealed wellbore pressure monitoring (SWPM), along with other corroborating methods such as fiber optics.
Stress and Barriers
What’s behind the striking differences reported by Devon?
The firm’s extensive data-gathering effort shows that the two primary factors driving difference in fracture growth rate are the rock’s stress state and geomechanical barriers which represent the boundary between two distinct benches or formations.
Horizontal stress magnitudes affect the extent to which fractures open. Additionally, the stress barriers between zones will influence vertical height and whether fractures propagate through different formations too quickly.
Secondary natural fractures further affect fluid movement by controlling leakoff, as do the properties of in-situ fluids.
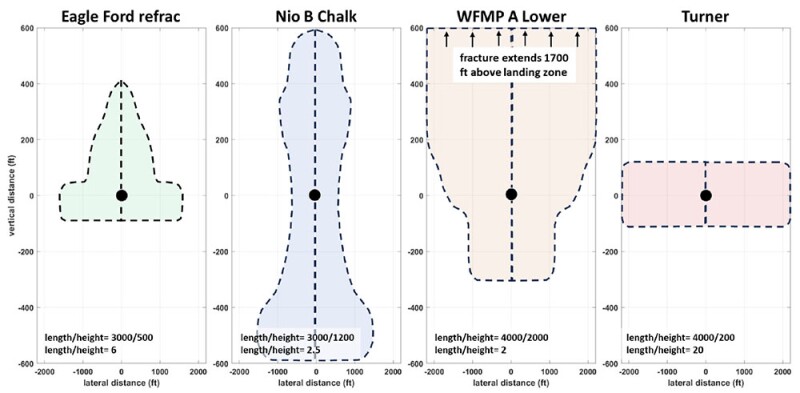
Other important rock properties to consider include Young’s modulus. At HFTC, Elliott explained that in rocks with a high Young’s modulus, like those found in the Anadarko Basin, fractures tend to have very narrow apertures causing them to extend far more laterally than vertically.
In contrast, the Delaware Basin in the Permian Basin has a lower Young’s modulus, which is one reason Devon has determined that fractures there can extend up to 4,000 ft laterally—fracture tip to fracture tip—and up to 2,000 ft vertically in a 2:1 ratio.
Sealed Wellbore Catalogue
SWPM provides direct insights into fracture propagation by detecting when a fracture from an actively stimulated well intersects a nearby sealed monitor well. When this occurs, the interaction induces subtle casing deformations, triggering small but measurable volume and pressure changes at the surface.
Devon uses SWPM as a derisking tool whenever it is testing new landing targets, infill well strategies, well spacing, multibench development, completion designs, etc. The data gathered is used to calibrate its models, which also reduces the need for SWPM on every well—a costly and impractical approach at scale.
The limited ability to deploy the homegrown technology has not kept Devon from amassing a high-confidence dataset of more than 12,000 fracture-driven interactions from 385 treatment-monitor well pairs across 15 formations in its five operating areas: the Powder River, Williston Basin, Anadarko, Eagle Ford, and Delaware.
The Delaware alone accounts for nearly 8,000 fracture-driven interactions, also known as frac hits, across 242 well pairs.
To determine fracture growth rate, Devon measures
- The distance between the treatment well and the monitor well.
- The injected volume at the first response in the monitor.
- The time elapsed before detection.
Using these inputs, the company generates a parabolic shape of the fracture and a length vs. time curve. Devon typically observes accelerated growth in the early stimulation phase, which is followed by a tapering effect in later phases.
The Delayed-Growth Model
In a Delaware Basin case study, Devon used SWPM to evaluate lateral fracture growth but initially believed vertical fracture propagation into an upper bench was minimal or nonexistent.
Although the company also applies SWPM in upper-bench wells to detect vertical growth, in this instance it turned to fiber optics—specifically for crosswell strain measurements—in vertical monitor wells. The approach revealed fracture propagation extending an estimated 1,400 ft vertically into the upper bench.
This blew away earlier assumptions, but it also meant that Devon could now generate a play-by-play account of how fractures in the Delaware extend outward, then grow upward and through higher rock layers.
Elliott explained what Devon calls in its paper “spatiotemporal evolutions,” noting they are not always linear.
“As fracture geometry increases in height, it may slow down, then rapidly break into another zone before slowing again,” he said. “This suggests we need to build up enough pressure to break through a barrier or baffle, and then the process starts over.”
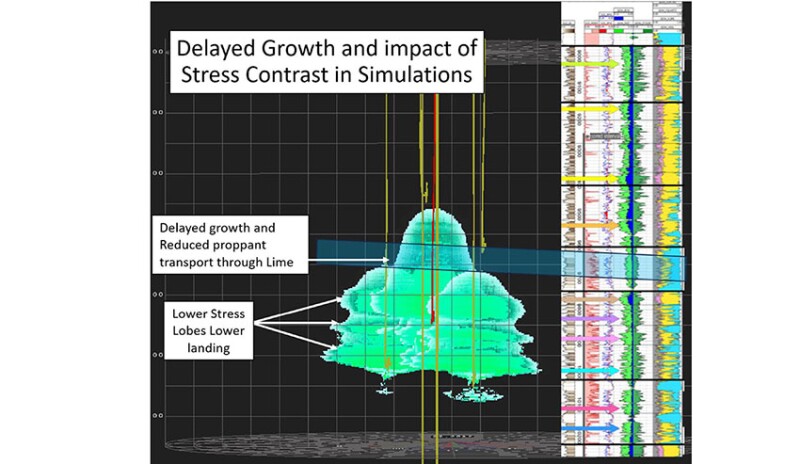
This learning forms the foundation for another new concept from Devon called the delayed-growth model. It helps calibrate the overall modeling effort by accounting for the observation that as a fracture hits a formation above (or below) its landing zone, e.g., a thin limestone layer, it will slow its growth, and its width will decrease until it overcomes the new stress profile of that rock.
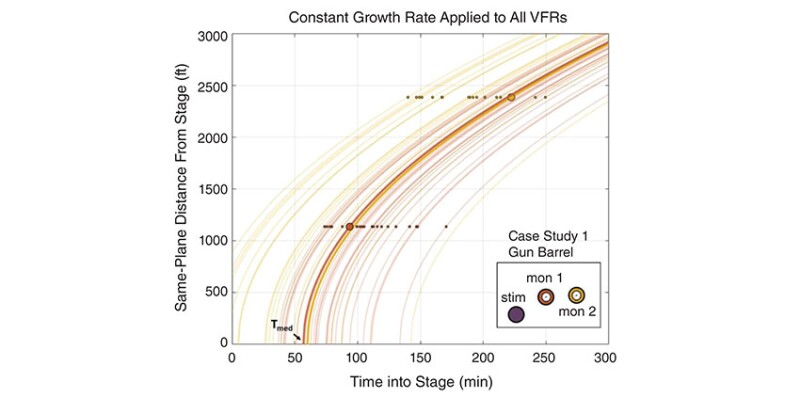
In a Delaware case study, Devon concluded that fractures from the originating formation broke into a higher formation after 75 minutes of pumping.
This finding, confirmed using two monitor wells during treatment, was so compelling that Devon’s subsurface teams began cross-referencing the data from all other stages and detected monitor-well responses.
The follow-up analysis and modeling showed that, on average, it took about 1 hour for a fracture from a stimulated zone to break into the upper zone 400 ft above within the case study well. Devon also determined that the volume of this growth—or the new fracture area being created—was about 110,000 ft2/min and that this rate remained constant for 2 to 3 hours.
Devon also detected post-pumping fracture growth in its work in the Permian—sometimes 2 to 3 hours after the pumps were shut down. To learn more, a subsurface team ran a model to see what would happen to fractures 2 or 3 hours after pumping ceased. The software replicated the field observations.
“We did not used to do that,” said Elliott of the extended post-job modeling runs. “But now we have to because of this effect.”
He added that Devon has since recognized post-pumping fracture propagation as a common phenomenon in reservoirs with high stress variability and pore pressure changes.
Using its arsenal of data and modeling insights, Devon now tries to estimate a P10–P90 distribution of growth rates, helping subsurface engineers identify when fractures enter a new layer.
A dataset shared at the conference showed a vertical breakthrough in just 25 minutes, which meant only 10% of the planned proppant was placed in the main target zone.
The risk, Elliott explained, is that if a well is designed to effectively prop Zone A, but most of the fracture energy shifts too early into Zone B, the intended completion strategy is severely undermined.
“We’ve since looked at this type of study and completely revamped our completion design in that area to try to mitigate this effect,” shared Elliott.
Without going into specifics, he said the adjustments made based on fracture growth rates may involve landing depth, fluid system selection, proppant ramp-up schedules, and well stimulation sequencing.
For Further Reading
SPE 223547 Stacked-Pay Development Insights From Routine Sealed Wellbore Pressure Monitoring (SWPM) by Brendan Elliott, Jackson Haffener, Trevor Ingle, Kyle Haustveit, Travis Black, Chris Ketter, Nick Ashley, and Brett Green, Devon Energy.