As shale reservoirs have become more challenging, understanding well performance has become more important. Understanding well performance requires understanding the methods and limitations associated with the analysis and interpretation of both pressure and production data.
Transient well analysis includes both traditional pressure transient analysis and production data analysis. The key to transient analysis is understanding how to recognize key flow regimes from their characteristic trends in the transient data. In this article we discuss the implementation of log-log diagnostic plots in the form of rate-normalized pressure (RNP) plots and the added value of buildup information when used to analyze, describe, and understand shale well performance.
Background
Shale is the most rapidly expanding source of natural gas production in North America today, and because of its low gas mobility and permeability, it requires hydraulic fracture stimulation to produce. Since the first experiments with hydraulic fracturing in 1947, more than 2.5 million of these jobs have been pumped worldwide, over a million in the US alone, and tens of thousands of horizontal wells have been drilled over the past 60 years. Grants from the US Department of Energy encouraged concentrated shale fracturing research in the 1970s (King, 2012). For these and other reasons, hydraulic fracturing is now the chosen solution for stimulating natural gas flow from shale source rock.
Well production rate data are always recorded and are frequently public, such as is the case in the US. While a well is on production, both rate and pressure are likely to vary over time. When pressure is also recorded on a regular basis, it is possible to analyze long-time production in a more rigorous manner than analysis performed in the absence of pressure data.
The concept of flow regimes is used to analyze both traditional pressure buildup (BU) tests and long-term production data. Type curves are not needed for these analyses because flow regimes are easily recognized as straight-line trends having characteristic slopes on log-log diagnostic plots.
Palacio and Blasingame (1993) graphed the instantaneous productivity index (given as the instantaneous rate divided by the difference between initial and flowing bottomhole pressure) against the material balance time. This method is a generalization of the Horner correction for time on production used in the Horner time function (i.e., cumulative production divided by the instantaneous rate for a given time). This construction allows long-term production data to be seen as virtual rate decline under constant pressure production, also known as rate-normalized pressure (RNP). While not commonly used because of easy availability of public production data and scarcity of public pressure data, RNP is actually the most straightforward method to use for well and reservoir characterization.
To effectively diagnose both near and far well transient behavior, Ehlig-Economides et al. (2009) proposed a combined pressure transient analysis (PTA) and production data analysis (PDA) approach. It is useful to review the expected succession of flow regimes on the RNP and RNP derivative presentation for shale gas production from a multiple-transverse-fracture horizontal well (MTFHW) in an ultralow-permeability formation. Fig. 1 from Song and Ehlig-Economides (2011) shows typical behavior for shale gas production from a horizontal well with multiple hydraulic fractures. In this case, the hydraulic fracture conductivity is effectively infinite. For hydraulic fractures with lower conductivity, the early behavior typically will be in the form of straight trends in both RNP and derivative with ¼ slope that are separated by a factor of 4.
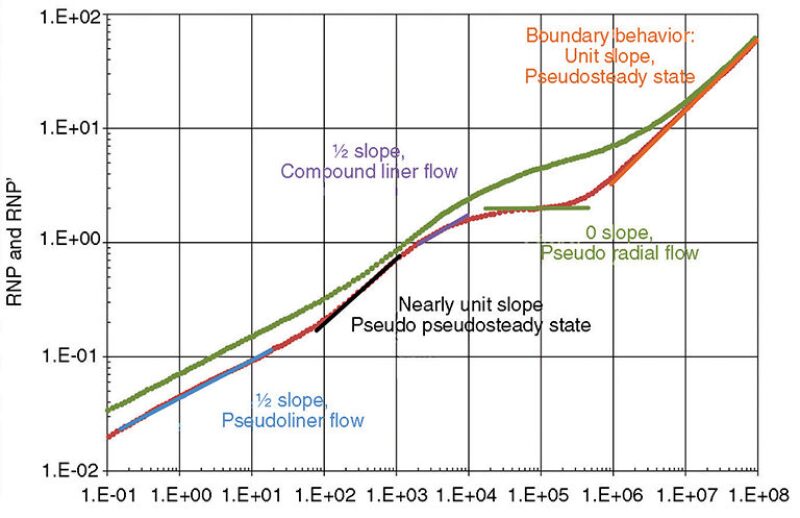
Transient behavior for a particular well is best represented as a sequence of flow regimes. The practical reality is that the complete sequence of flow regimes is never seen for any given shale well because each succeeding flow regime typically takes from a fraction of a logarithmic time cycle to several at a time, each of which represents 10 times the length of the previous cycle.
It is important to note that the succession of flow regimes seen in any model can require a time range from a fraction of a second to 1,000 years or more. This implies that at least 10 log cycles may be required to capture the complete succession of flow regimes.
Fig. 2 shows the practical time windows in BU test and long-term production data. Two practical time windows are shown—a short-term BU test period from 1 second to 1 day, or 5 log cycles; and a long-term production period from 1 day to 30 years, or 4 log cycles—giving the total practical time windows of 9 log cycles.
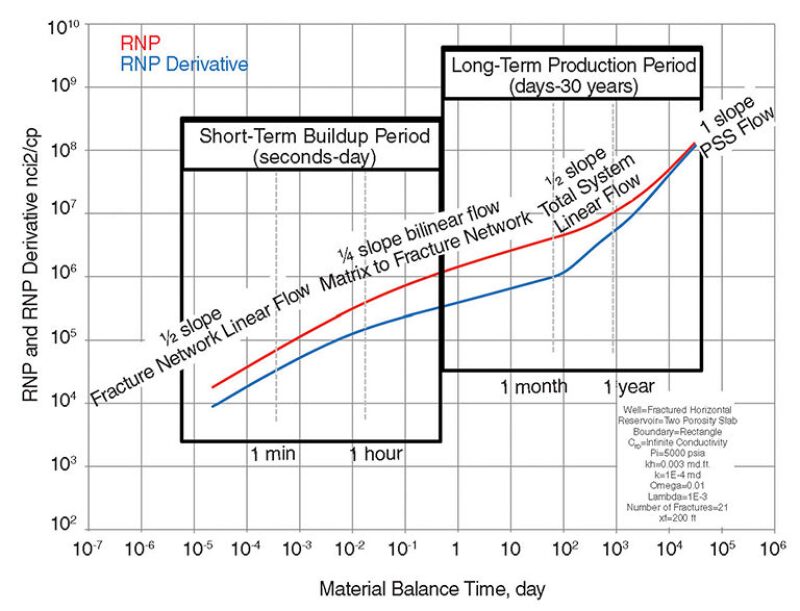
A BU test is meant to imply high-rate data sampling during shut-in with rates as frequent as a sample per second. Lower-frequency BU data (i.e., daily or even hourly) does not deliver much more information than daily production data would provide. Flow regimes related to hydraulic fractures may appear in less than 24 hours and are frequently absent in long-term daily production data.
Applications
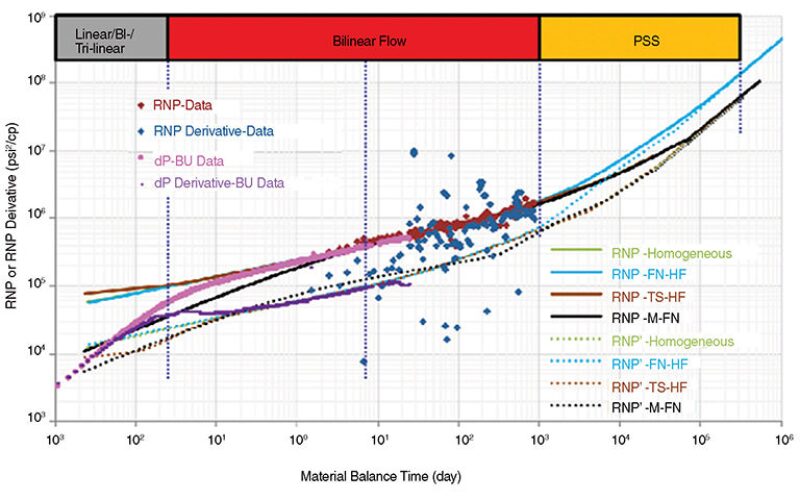
When a buildup is present during the production life of a well, its information becomes useful for production analysis. Fig. 3 shows a buildup with data collected every 30 seconds and gives at least 2 log cycles of additional information at an early time period which cannot be seen on long-term production data. This case from the Horn River shows permeability in ranges from 16 to 40 nanodarcies (nd), and several models, including those showing evidence of pre-existing natural fractures, can be differentiated during the early time period. Unifying PTA and PDA, we overlay both responses to imply that only the model with finite hydraulic fracture conductivity can match the whole dataset. A further explanation about this figure and its different models can be found at Appiwathanasorn and Ehlig-Economides (2012).
If more than one buildup is available, the series of rate-normalized buildups may be used to yield a significantly better flow regime characterization. This particular feature was shared by Vera and Ehlig-Economides (2013) and may aid young professionals in understanding certain aspects of reservoir and hydraulic fracture behavior such as changes in conductivity, fracture morphology, or pressure-dependent permeability (PDP).
Fig. 4 shows two examples of sequential buildups from different formations. The left-side graphic shows two buildup tests acquired about 8 months apart going from ¼ to 1/8 slope trend in pressure change and derivative. The right-side graphic shows three buildups with straightforward ¼ slope trends in both pressure change and derivative.
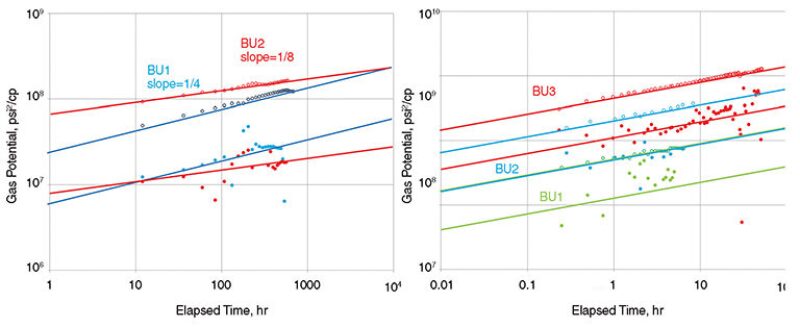
The left side of Fig. 4 indicates that both pressure change and derivative are lower than observed from the first buildup towards the second buildup. The ¼ slope trend represents bilinear flow, and the 1/8 slope represents trilinear flow. The bilinear flow may represent flow from a natural fracture network to hydraulic fractures, from the shale matrix pore space to hydraulic fractures, or from the shale matrix porosity to a natural fracture network then to hydraulic fractures and on to the wellbore. Trilinear flow represents simultaneous transient flow in all three media, and this response has not appeared in pressure transient data shown in the literature. The flow regime was first explained by Cinco-Ley and Meng (1988). The change from bilinear to trilinear flow occurring over the same timeframe may mean that the medium that was not flowing with detectable gradient increased in permeability enough to contribute to the overall flow behavior.
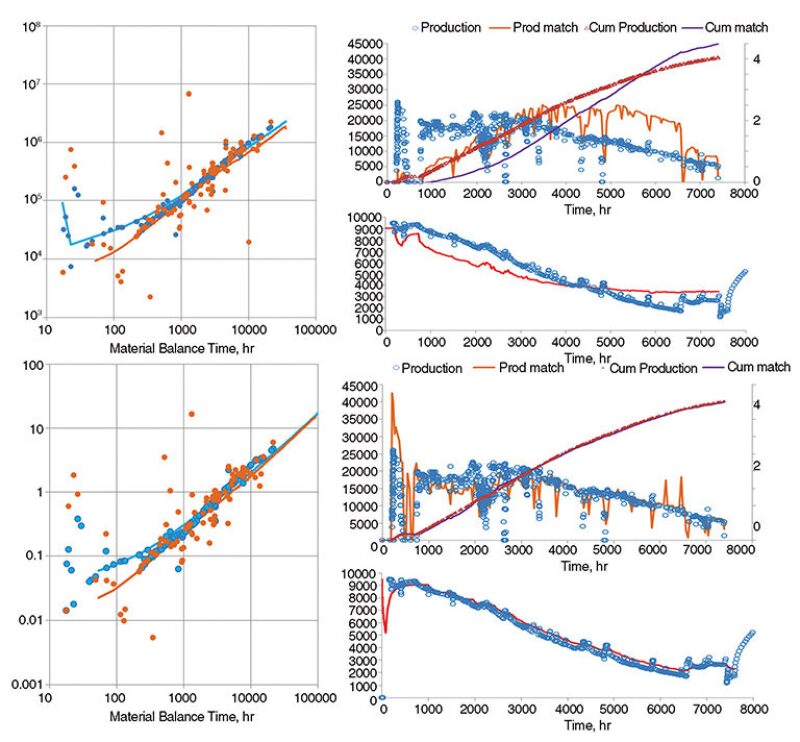
On the right side of Fig. 4, all three buildups from a Haynesville well show straightforward ¼ slope trends in both pressure change and derivative increases with time. This suggests that matrix and/or fracture permeability may be decreasing over time from 2960 nd to 145 nd and fracture conductivities from 16.5 to 0.98 md-ft. The derivative level has dropped by about a factor of 10 from the first to the third buildup and makes model matching highly non-unique if PDP is not considered.
Fig. 5 shows a match using matrix PDP. Because we have achieved similarly good matches for models with longer fracture half-length, the results are not unique. The longer the assumed fracture half-length, the larger the influence of PDP. Microseismic monitoring could perhaps be useful in this situation to reduce the uncertainty of the PDP model. Given the fracture half-lengths in the different matches, gas recovery may vary by a factor of 2.
Conclusions
Consideration of flow regime sequence, as opposed to consideration of only individual flow regime, is a powerful tool for reservoir engineering. When more than one flow regime is observed in the data, it is possible to acquire more consistent model matches. Comparisons among possible models can provide insight into how important fracture complexity is to well performance.
In conventional reservoirs, it is expected to see radial flow in these log-log plots. In unconventional reservoirs, you may consider the method a failure because radial flow never appears in either pressure transient or production data analysis when, in fact, radial flow will not appear within practical times of testing and that is why the sequence of flow regimes needed to understand unconventional reservoir characteristics becomes important.
Despite the lower cost of producing a gas reservoir compared with producing an oil reservoir, the operations required to test a gas well nonetheless represent a cost. If you have an operational buildup, it is highly recommended to acquire such a test and describe its current behavior; it is like a photograph of the well that can be used to improve production data analysis. Any near-well behavior captured by the buildup as well as clean-up and fracture morphology are areas to consider in any production data analysis modeling, reflecting the importance of time-dependence and drainage area and aspect ratio on estimated ultimate recovery.
It is worth noting that in all cases studied, buildup transients exhibited bilinear—and in one case trilinear—behavior characteristics of finite conductivity fractures. A well equipped with a permanent downhole gauge can provide valuable data about changes in hydraulic fracture and/or shale effective permeability over time that cannot be diagnosed directly from long-term production data alone. Even when pressure-dependent permeability is not evident, buildup transients improve estimates of fracture conductivity, especially when acquired at a higher data rate than the daily rate typical for production data.
The techniques discussed here also reduce uncertainty for producing fracture half-lengths, which are usually shorter than we would like to believe. It is this particular half-length that is contacting the reservoir that makes production possible. The analyses presented should also encourage stimulation designs that focus on connecting as much of the drilled well to productive reservoir as possible, with the emphasis on the near-well environment and its equidistant effect on simulation models. TWA
References
Appiwathanasorn; and Ehlig-Economides, C.A. 2012. Evidence of Reopened Microfractures in Production Data Analysis of Hydraulically Fractured Shale Gas Wells. SPE Canadian Unconventional Resources Conference, Calgary, Alberta, Canada. SPE 162842-MS.
Economides, M., and Martin, T. Modern Fracturing. Gulf Publishing Co. 2007.
Ehlig-Economides, C.A., Martinez, H., and Okunola, D.S. 2009. Unified Pta and Pda Approach Enhances Well and Reservoir Characterization. Latin American and Caribbean Petroleum Engineering Conference, Cartagena de Indias, Colombia. Society of Petroleum Engineers. SPE-123042-MS. DOI: 10.2118/123042-ms.
Cinco-Ley, H., and Meng, H.-Z. 1988. Pressure Transient Analysis of Wells With Finite Conductivity Vertical Fractures in Double Porosity Reservoirs. Paper SPE 18172. SPE Annual Technical Conference and Exhibition, 2–5 October, Houston, Texas. ISBN 978-1-55563-578-7.
King, G.E. 2012. Hydraulic Fracturing 101: What Every Representative, Environmentalist, Regulator, Reporter, Investor, University Researcher, Neighbor, and Engineer Should Know About Estimating Frac Risk and Improving Frac Performance in Unconventional Gas and Oil Wells. SPE Hydraulic Fracturing Technology Conference, 6–8 February, The Woodlands, Texas, USA. Society of Petroleum Engineers. SPE-162842-MS. DOI:10.2118/152596-MS.
Palacio, J.C., and Blasingame, T.A. 1993. Decline-Curve Analysis Using Type Curves—Analysis of Gas Well Production Data. SPE Joint Rocky Mountain Regional and Low Permiability Reservoirs Symposium, 26–28 April, Denver, Colorado. Society of Petroleum Engineers. SPE-25909-Preprint.
Song, B., and Ehlig-Economides, C.A. 2011. Rate-Normalized Pressure Analysis for Determination of Shale Gas Well Performance. North American Unconventional Gas Conference and Exhibition, 14–16 June, The Woodlands, Texas, USA. Society of Petroleum Engineers. SPE-144031-MS. DOI: 10.2118/144031-ms.
Vera, F., and Ehlig-Economides, C.A. 2013. Diagnosing Pressure Dependent Permeability in Long Term Shale Gas Pressure and Production Transient Analysis. SPE Annual Technical Conference and Exhibition, New Orleans, Louisiana, USA. Society of Petroleum Engineers SPE-166152-MS.
Fabián Vera is a reservoir engineer at Baker Hughes and currently assigned at the Applied Reservoir Technology Group of Pressure Pumping in Tomball, Texas. Previously, he earned a BS degree in petroleum engineering at ESPOL University in Guayaquil, Ecuador, and then worked as a shale gas research assistant while he earned his MS degree in petroleum engineering from Texas A&M University. He has coauthored several SPE technical papers for the SPE Annual Technical Conference and Exhibition, served as the SPE Ecuador Section young professional chair in 2010, placed fourth in the 2014 International Young Professionals Competition at the International Petroleum Technology Conference, and currently serves as SPE young professional networking coordinator for the Gulf Coast Section in Houston, Texas.
Christine Ehlig-Economides is a professor of petroleum engineering and holds the Albert B. Stevens endowed chair at Texas A&M University. Previously, she worked 20 years for Schlumberger in well-test design and interpretation, integrated reservoir characterization, modern well-construction design, and well stimulation. She is a member of the US National Academy of Engineering. Ehlig-Economides earned a BA degree in math-science from Rice University, an MS degree in chemical engineering from the University of Kansas, and a PhD degree in petroleum engineering from Stanford University. She has worked in more than 30 countries, authored or coauthored more than 60 papers, and received several SPE awards—among them the Lester C. Uren and the Anthony Lucas Gold Medal awards.

