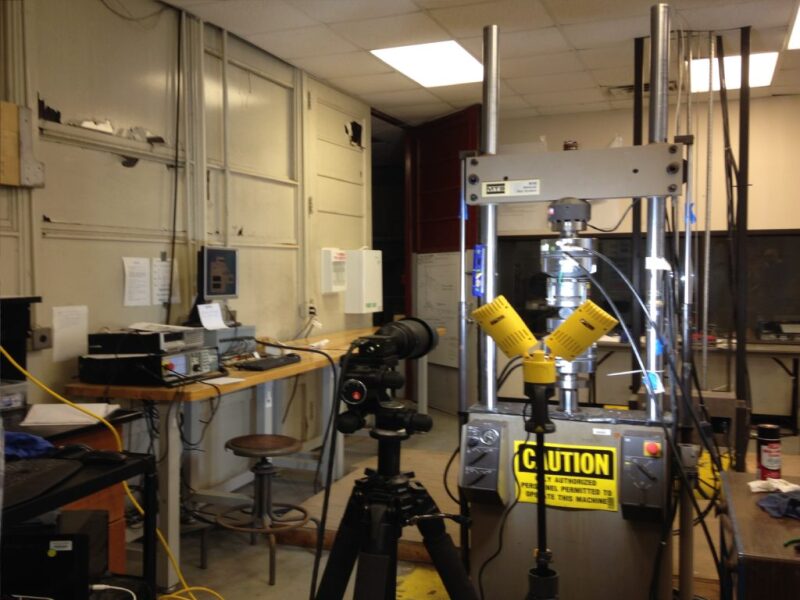
Digital image correlation (DIC) is routinely used in modern mechanical engineering to analyze the strength of building materials. Geologists have used the technology for the same reason in the study of mines.
Now, researchers from the University of Louisiana at Lafayette are making the case that DIC can also help petroleum engineers—specifically those in the business of hydraulic fracturing. The ultimate aim: an index of unconventional rock types based on a quantification of their ability to be stimulated, or what oil and gas producers simply call “fracability.”
DIC technology has a few variations, but this application involved the coupling of a high-speed camera with commercial change-tracking software. This simple approach allowed researchers to see frame-by-frame how lines of strain building up inside compressed rock samples directly correlated to where fractures would form a few seconds later.
The work was first presented earlier this year in a technical paper at the SPE Hydraulic Fracturing Technology Conference.
Mehdi Mokhtari, the lead researcher and an assistant professor of petroleum engineering at the university, said the project served as proof of concept for the technique that he hopes may explain some of the unknown factors associated with fracture behavior.
“If we can better understand these fractures, then we can optimize the number of stages needed in each well so we don’t over-fracture a formation, or do less than what is required,” he said, adding, “And from an environmental point of view, we can also say for sure what is going on inside our reservoirs.”
Mokhtari is underscoring the fact that there are missing pieces to the scientific standard that the oil and gas industry uses to predict how hydraulic fractures form or grow. These gaps are often cited by those who view traditional hydraulic fracturing models as unreliable when applied to unconventional reservoirs.
More Data Points
One of the major advantages of the DIC approach is that it can collect hundreds of data points per test vs. conventional strain gauges that yield only a single data point. DIC also stands apart in that it is a non-contact monitoring method, while strain gauges must be physically attached to a test sample and therefore always represent a potential source of interference.
As the paper explains, initial testing involved two types of rock: a homogeneous sandstone (used as a baseline) and a more complex and naturally fractured Buda Limestone rock from south Texas—a tight-rock found beneath the Eagle Ford Shale.

Once extracted from a larger core sample, the side of each sample facing the high-speed camera was then sprayed with a black-and-white speckled paint. Each little speckle provided the software a reference point to watch for as stress was applied via a pneumatic press in a procedure known as the Brazilian Test.
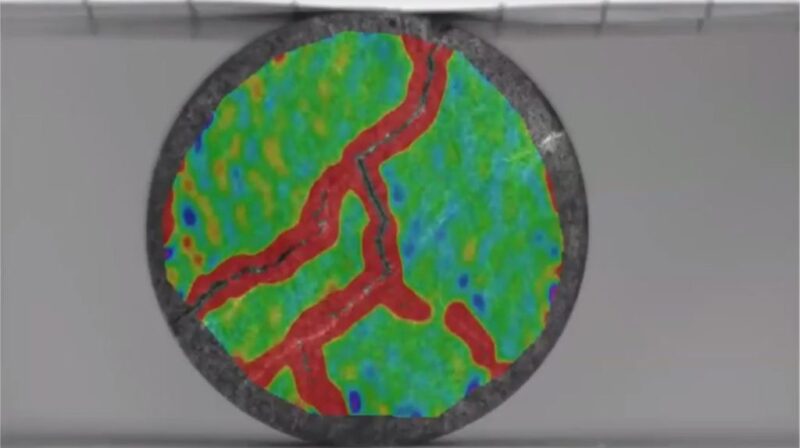
The paint is critical to this type of experiment because the sole focus of DIC technology is to compare the original image taken as the test begins with all subsequent images. Any deformation or physical change to the face of the sample is assigned a color code, rewarding researchers with easy-to-interpret visual data.
As a test initiates, areas under low to no strain are shown in green. Where strain is intensifying, thin red lines quickly appear and then grow thicker. “And when the rock finally breaks, it will do so along those lines,” said Mokhtari.
In baseline tests, the homogenous samples with no natural fractures tended to split vertically down the middle, as expected. The DIC data showed in these samples the point of maximum strain, or where the rock failed, lined right up with the direction of the applied load.
With the naturally fractured samples, the induced fractures were far more complex and tended to branch off in different directions. Mokhtari said this supports the idea that natural fracture orientation and the bonding material that fills those fractures are important drivers for fracture growth.
However, these conclusions are largely qualitative and do not describe these drivers in great detail. On that front, Mokhtari said more work will need to be done to connect this experimental testing method to real-world hydraulic fracturing operations.
“I didn’t want to over-generalize the results” in the paper, he said. “But I think at this point, we’ve shown that this technique works and has a lot of good applications.”
Mokhtari is currently seeking grants and industry partners to help carry on this research. He added that with more study, it may be possible to discover what the laws of fracturing behavior are. That work would begin with simpler sandstones before tackling more complex shale rocks. The data collected could be used to strengthen numerical models and simulators.


