One of the major challenges in fracturing low-permeability gas formations is the loss of well productivity caused by fluid entrapment in the matrix or fracture. Studies have suggested that this water is trapped in the rock matrix near the fracture face and remains trapped because of the high capillary pressure in the matrix. This study shows that, in regard to hydraulic fractures in horizontal wells, the fluid may also be trapped within the fracture itself and may affect the cleanup as well as productivity.
Introduction
The loss of fracturing fluid and its impact on the productivity of hydraulically fractured wells have been studied for many years. Conventional wisdom suggests that the liquid is trapped at the fracture face because of capillary effects. This reduces the relative permeability of the hydrocarbon phase during flowback. Most studies published thus far on the subject ignored the accumulation of liquid in the fracture itself and the effect of gravity and fluid segregation in the fracture. In this study, we show that liquid accumulation in the fracture itself can be significant and that this fluid saturation is coupled with the fluid saturation in the matrix, leading to a very different cleanup profile and time scale for cleanup. A 3D reservoir simulator was used to investigate liquid loading in hydraulic fractures in a horizontal well. Generally, hydraulic fractures in horizontal wells range from tens to hundreds of feet in height. If liquid loading takes place in a certain section of the fracture, it will impair the flow of gas there. This will lead to a reduction in the effective producing fracture area, even if the drawdown is greater than the capillary pressure.
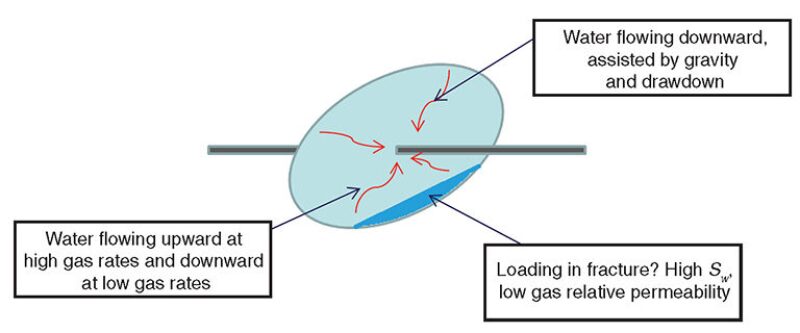
Liquid Loading Inside the Fracture. The desired lift velocity for unloading liquid and the available gas velocity in a fracture differ by almost two orders of magnitude. It is, therefore, very likely that the lower portions of fractures will be filled with liquid when production is initiated. This suggests that concerning load recovery from hydraulically fractured horizontal wells, even if the drawdown is able to overcome the capillary pressures, the inflow gas velocity may not be high enough to lift the liquid against gravity into the wellbore (Fig. 1). Liquid loaded inside the fracture in this way will affect the productivity of the well and the cleanup of the matrix. Understanding the conditions for liquid loading within the fracture will help identify remedial measures, which may be significantly different from remedial measures for reducing liquid blocking at the fracture face.

Simulation Setup
In this study, a 3D gas/water black-oil reservoir simulator was used to model a single, planar hydraulic fracture in a horizontal wellbore. Fine-scale gridding was used near the fracture face along the horizontal wellbore to monitor the liquid buildup in the matrix and in the fracture accurately. To simulate the fluid loss during the fracturing operation, 1,000 bbl of water was injected into the formation. This was followed by a shut-in time and then production. Various scenarios were run to investigate the effect of different reservoir or fracture properties on water blockage within the fracture and on gas recovery. Considering the unavailability of reliable drainage/imbibition curves for shales, this study uses the J-function for Berea sandstone and then scales capillary pressures according to the respective porosity and permeability of the reservoir. Gravity (Bond number) and the capillary pressure (capillary number) in both the fracture and the matrix play an important role in the cleanup of the water.
Results
The base-case scenario studies a reservoir at residual water saturation, a flowing bottomhole pressure of 4,500 psi, and a shut-in wait time of 30 days after the fracturing (slickwater injection) process is over before production is initiated. At the end of a 500-day period, the cumulative gas recovery is 70.7 MMcf and the cumulative water recovery is 279 bbl. This means that out of the 1,000 bbl of fracturing water pumped, only 28% is recovered. The remaining 72% is still trapped, either in the matrix or in the fracture itself.
There are a couple of interesting observations to be made. Because the well is kept shut-in until the 30th day and the reservoir is water-wet, the water saturation inside the fracture keeps declining until the 30th day because of imbibition into the matrix. As soon as the production is initiated, water comes out into the fracture from the formation and the saturation increases and then declines. Continued production leads to cleanup of water that is present inside the fracture. The bottom of the fracture does not clean up for a while. As the block pressure gradually approaches the flowing wellbore pressure, gas velocities increase proportionally to the drawdown, and as soon as the velocity is large enough to lift the water out of the fracture, the bottom of the fracture starts cleaning up.
Another important point is that the matrix (the near-fracture face) does not start cleaning up until the fracture is cleaned up completely. This is because the two zones are in equilibrium, and if there is water inside the fracture, the matrix will keep imbibing it. As soon as no more water can be imbibed, the drawdown will produce the water into the wellbore, though at a very low rate because of its very low relative permeability.
Effect of Matrix Permeability on Liquid Loading. Increasing the matrix permeability leads to reaching the peak productivity earlier. When the matrix permeability is reduced, there is a considerable amount of water present at the bottom of the fracture even after 1 year of production (the top cleans up by the 300th day). Considering that drawdown is still the same as in the base case, this accumulation of water can be explained by the lower gas velocity in the fracture. When the matrix permeability is reduced, not only does the flow of gas become more constrained, but also the capillary blocking of water increases. This leads to a lower gas-flow rate, which is not able to lift the water from the bottom of the fracture because it is less than the critical lift velocity. The cumulative gas production in this case is 7.5 MMcf, and the cumulative water recovery is 154.2 bbl (15.4%). It is evident that water is trapped not only in the matrix, but also in the fracture.
For a matrix permeability of 10 µd (all other parameters being the same), the cumulative gas and water recoveries were 219.7 MMcf and 276 bbl (27.6%), respectively. Considering the high matrix permeability, the gas velocity in the fracture is also high and, therefore, the cleanup of the bottom of the fracture is relatively quick compared with the base case. Another important fact is that even though water recovery is essentially the same as in the base case, the cumulative gas recovered is almost three times as much.
Effect of Fracture Permeability on Liquid Loading. Lower fracture permeability leads to lower gas productivity in the initial cleanup phase. The peak of productivity is also delayed slightly for the lower-permeability case.
Within the fracture, the liquid at the top of the fracture is cleaned up fairly quickly. This is because gravity, assisted by higher permeability, pulls the fluid down rather easily, so this liquid is either produced or deposited at the bottom of the fracture. The cleanup of the bottom of the fracture is slow until approximately the 375th day, and then it picks up. The water saturation in the matrix adjacent to the fracture-face bottom remains consistently high throughout the measured period. However, the matrix near the fracture top starts cleaning up as soon as that portion of the fracture cleans up. This may indicate that gas flow is primarily occurring from the top part of the fracture, where the liquid from the fracture face has been removed. The cumulative gas and water recoveries in this scenario are 70.27 MMcf and 245.8 bbl (24.5%), respectively. Because the reservoir conditions were not altered, the gas recovery is almost the same as in the base case.
If a lower fracture permeability of 0.2 darcies is considered, cumulative gas and water recoveries are 64.3 MMcf and 249.4 bbl (24.9%), respectively. The fracture cleans up by the 300th day, at both the top and the bottom of the fracture. This is because water produced from the matrix does not accumulate at the fracture bottom because of high fracture permeability. Cleanup is governed by drawdown and is, therefore, uniform at the top and bottom.
Effect of Drawdown on Liquid Loading. It is evident that lower drawdown leads to lower gas velocities, and that the liquid stays at the bottom of the fracture for a longer duration. It is interesting to note that, at higher drawdown, the top of the fracture takes longer to clean up than at lower drawdown. This is because, at lower drawdown, a smaller amount of water will escape the matrix capillary forces, and, therefore, this water will be cleaned up more quickly.
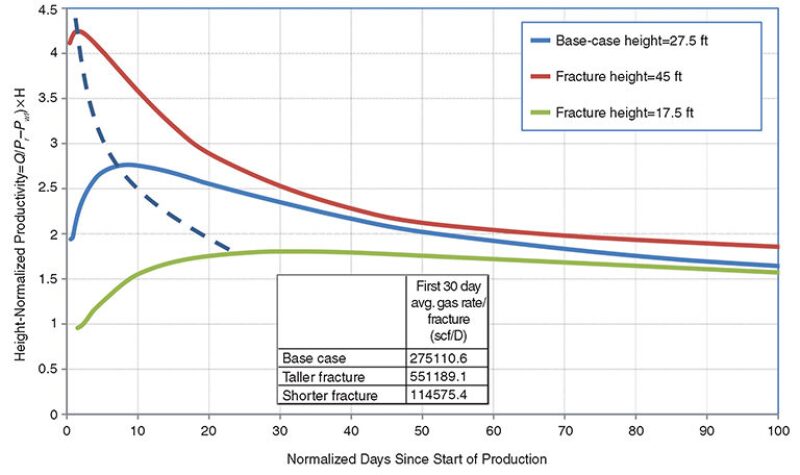
Effect of Fracture Height on Liquid Loading. Fig. 2 shows the effect of fracture height on the productivity in the initial flowback period. It shows that reducing the fracture height delays peak productivity. In the base case, the fracture vertical extent (top to bottom) is considered to be 55 ft in a reservoir with a net pay of 100 ft. If fracture height is increased to 90 ft, there is no liquid loading at the bottom of the fracture and the cleanup inside the fracture is much faster than in the base case. The cumulative gas and water recovered in this case are 108.8 MMscf and 190.5 bbl (19.5%), respectively. The higher cumulative gas can be attributed to a higher surface area of the fracture, leading to more reservoir contact. As fracture volume and surface area increase, the depth of invasion for the same volume of fluid injected becomes less. Less invasion leads to less liquid blocking on the fracture face, which leads to a higher gas rate and, therefore, faster fracture cleanup.

This article, written by JPT Technology Editor Chris Carpenter, contains highlights of paper SPE 163837, “Impact of Liquid Loading in Hydraulic Fractures on Well Productivity,” by Samarth Agrawal and Mukul M. Sharma, SPE, The University of Texas at Austin, prepared for the 2013 SPE Hydraulic Fracturing Technology Conference, The Woodlands, Texas, USA, 4–6 February. The paper has not been peer reviewed.
