
Ideally, a managed-pressure-drilling (MPD) system should have not only highly accurate sensors measuring critical mud-flow data and automated chokes to maintain desired annular pressure precisely but also the ability to aggregate, analyze, and display this real-time information on monitors on the rig floor and in remotely located centers. This paper describes a number of system enhancements, including the ability to display and analyze not only the critical parameters of drilling hydraulics but also other information that allows different perspectives in considering the closed-loop system.
Introduction
MPD offers a number of accepted applications while increasingly being considered for any other operations requiring precise pressure control. There has been a growing trend for MPD providers to be more involved in drilling, well-construction, and completion operations as their safety value and effectiveness is realized.
A new platform has been developed for the next-generation MPD system. The goal was the development of a user-friendly system that will improve critical decision making and execution by providing enhanced visual feedback and interaction. This may include preengineering, operation and post-job analysis, automation of time- and pressure-sensitive tasks, multiple software engines being able to evaluate limits, and multiple components being controlled in one place.
System Architecture
The new platform has been developed by use of a layered architectural approach and an object-oriented style. The layers of an application may reside on the same physical computer or may be distributed over separate computers; the components in each layer communicate with components in other layers through well-defined interfaces. Distributing the layers over multiple physical tiers improves scalability, fault tolerance, and performance, which increases availability.
There are also multiple physical components making up the system—for example, an intelligent control unit (ICU) houses electronics, including a programmable-logic controller. Single- or multiple-ICU-equipped systems can be connected through a universal switch that not only will serve as a central hub but also will provide plug-and-play ability for wellsite-information-transfer-specification (WITS) communication and additional analog sensors when required. The ability to function as a local WiFi hot spot, without interrupting operations or portability, and enabling a secure connection to external networks are other requirements for this universal switch. In addition, multiple computer stations will be hosting database servers, data-acquisition processes, real-time hydraulics, and other engines.
Although all computer stations (panels) are identical on the background, they will have dedicated roles and will work in a hierarchy, with one being designated as master while the other stations are running as backups. The master station will collect all data needed, execute calculations, store data in a database, and publish data to subscribers. Backup stations will check the “heartbeat” and will store data received from the master. In this way, valuable real-time data will be copied safely across multiple computer stations. To achieve fail-safe operation, in case of master-station failure, the master role will be transferred automatically to one of the backup stations.
Torque and Drag (T&D)
Numerous T&D-analysis applications have been developed to predict forces experienced by tubulars during different rig operations. Although T&D software has existed for more than 25 years, some confusion still exists over the validity of the models used to characterize drilling-and-completion operations.
Generally speaking, two types of mathematical models are in use for T&D analysis, soft-string and stiff-string. Most T&D software uses a soft drillstring model as standard because of the simplicity of its algorithm and its provision of a nearly immediate computer calculation. A common method used for envisioning the underlying physics for soft-string models is to consider the drillstring to be a weighted cable. The shape of the weighted cable exactly conforms to the shape of the wellbore, so the inclination, azimuth, and curvature at each point along the wellbore are perfectly matched by the drillstring. Drag is developed because of axial movement of the drillstring up or down as a result of friction with the wellbore. Resistance to movement of the drillstring is determined by a force equal in magnitude to the coefficient of friction multiplied by the normal (or contact) force between the drillstring and wellbore. Torque is developed because of circumferential, or rotary, movement of the drillstring against the wellbore, again because of friction. The main problem in determining the resistance to rotary motion is deciding what radius to use for the moment arm (for a discussion of different approaches used to meet this challenge, please see the complete paper).
Stiff-string models, on the other hand, are intended to be a more-accurate and -realistic approximation of string behavior in a hole: able to consider correctly the impact of tubular stiffness, hole clearance, and tortuosity effects. Although not all stiff-string models are equal, there is still no industrial standard formulation for a stiff-string T&D model. As a result, some stiff-string models account for bending stiffness but not for radial clearance, while others appear to model only portions of the string accounting for both effects. The main problem holding back the development of an industrial standard stiff-string model is perhaps the complexity of the numerical algorithm (and the substantial running time required).
In the next-generation MPD system, the soft-string conventional T&D model will be used as a default and stiff-string modeling will play a role in special applications and more-meticulous analysis. Some minor improvements have been incorporated into the original model for critical-buckling loads on linear close-to-vertical well intervals, as well as additional centrifugal effects on contact forces for the operations with rotation. The drillstring is modeled as a cable that is divided into small elements that carry only axial loads and torque; contact forces are supported by the wellbore. The forces on the elements consist of tension, compression, and torsion that cumulatively build from the bottom of the string to the surface.
The stiff-string T&D mathematical model is based on the method used for the drillstring dynamic analysis in a well. Its core consists of a system of dynamic equations for lateral, torsional, and axial modes of a drillstring. The ability to obtain a steady-state solution through the numerical simulation of a dynamic problem allows its use for T&D analysis. In this case, integration of dynamic equations over time is an iterative procedure establishing the steady state of drillstring and contact forces required for T&D analysis. The initial conditions for the drillstring in the wellbore are specified in the first stage of the integration process. This stage is used for identification of the natural position of the drillstring inside the hole, which includes locating all contact points in a 3D well under gravitational force, friction, and contact forces. Then, to suppress the inevitable increases in oscillation, corresponding artificial damping should be introduced into the numerical scheme. This numerical technique permits rapid decay of transient processes without introducing any disturbance into the overall steady-state equilibrium dynamic results. Use of the artificial-mass and -damping techniques decreases the running time to achieve steady-state dynamic equilibrium or full decay of the transient intermediate processes.
The result of the steady dynamic state is a solution of the static equations for zero acceleration values, converting systems of dynamic equations into ones similar to conventional soft-string equations for T&D and ones that represent steady-state equilibrium of forces acting normally to the borehole and that determine the distribution of the contact forces along the length of the drillstring.
For a discussion of the mathematics of the hydraulic model, please see the complete paper.
Process Automation
Process automation primarily targets sensitive operations that require a high level of experience or emergency situations when reaction time is a matter of life and death. Well control is a good example of both. There are training and certification requirements in place, dictated by authorities, and early detection and timely response are essential to prevent injury. Some authors have compared conventional vs. automated kick detection and responses and claim that automatic detection and control capability limits the total volume of formation fluid getting into the wellbore and improves overall safety by reducing reaction time significantly during well-control events. Imagine that a top-level well-control expert could be deployed in every location—an expert with no need for sleep, an eye on every critical sensor reading, the ability to learn and improve continually, and a consistent performance.
However, well control is not the only promising area to which automation could be applied. Setting and circulating pills, injectivity tests, pore-pressure determination, dynamic formation-integrity tests, cementing, MPD connections, and many other drilling and well-completion procedures are considered for automation in the new system. A “control-algorithm” concept is defined that accommodates a standard or user-defined sequence of steps and allows the user to modify critical parameters and to adjust more effectively for custom operations represented in a flow-chart format.
Engineering
A new platform is planned to bring advanced engineering capabilities to oilfield operations, whether situations are developing as planned or are going in a different direction. Monitoring raw data is well and good, but assessing a situation requires more. A state-of-the-art system should be able to process proper inputs and perform analysis to provide more-meaningful warnings to the user. A flow-out increase in a closed-loop system, for example, may be a sign of an influx during regular drilling operations, while it may be considered as normal during tripping. A system that can identify the difference by calculating expected fluid displacement vs. total gain can provide a much clearer message to a decision maker.
This means that the system not only should identify events and provide warnings in real time, but also should be capable of running hypothetical simulations to predict possible consequences. Some of these predictions can be made easily in real time, while some others require longer time with available processing power.
Visualization
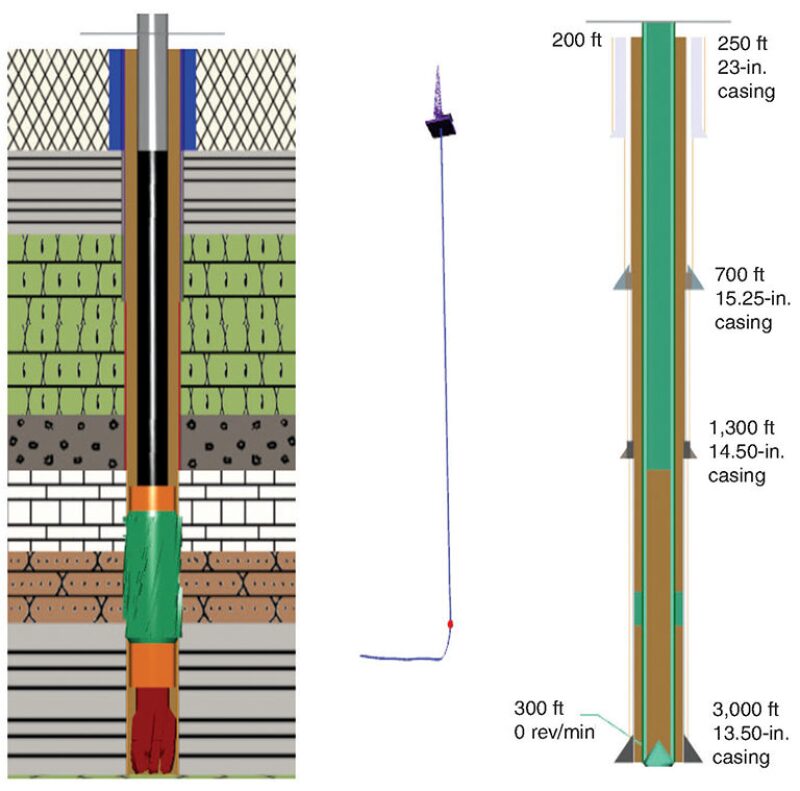
The move toward a more-automated and less-human-dependent system does not change the fact that the ultimate decision maker is the user. The goal is to improve the user’s ability to make better decisions with minimum effort. With this in mind, live well display has been developed (Fig. 1 above).
Selected measurements and WITS and calculated data will be shown along with time- or depth-based graphs on live well displays. Overbalance/underbalance indications, real-time fluid tracking (including kick fluids), critical observation-point marks with necessary information, customizing options, 2D vs. 3D views, and zooming are some of the features that will be put in place to enable the user to understand what is happening in the well.
In addition to well views, surface equipment and piping-and-instrumentation diagrams (P&IDs) will also be represented in a similar format to simplify day-to-day tasks for the user such as entering system setup information, entering maintenance records, and checking equipment specifications. P&IDs will represent actual job configurations, and related calculations such as frictional loss or fluid velocity through a certain section will be performed by the system accordingly.
This article, written by JPT Technology Editor Chris Carpenter, contains highlights of paper OTC 25164, “Live Well Display and Automated Data Analysis To Improve Timely Well-Control and Drilling-Optimization Decision Making in MPD Operations” by Ferhat Gumus, Ilia Pobedinski, Don Hannegan, Khaydar Valiullin, and Douglas R. Simpkins, Weatherford, prepared for the 2014 Offshore Technology Conference, Houston, 5–8 May. The paper has not been peer reviewed. Copyright 2014 Offshore Technology Conference. Reproduced by permission.