

This article addresses a means to improve hydraulic fracturing operations by measuring the perforation effectiveness on a stage-by-stage basis before the hydraulic fracturing process begins. Observations lead to the conclusion that pre-frac measurements provide meaningful insight about well-to-reservoir opening, allowing operators to identify the difficult-to-treat stages before the treatment begins. Based on the results of a case study from a North American unconventional basin, the limitations and conditions for employing pre-frac measurements are discussed.
Background
Often, perforation operations fail to initiate a well-established hydraulic communication between the wellbore and the reservoir rock. When hydraulic fracturing operations begin, a lack of wellbore to reservoir connectivity may cause unexpected difficulties such as unusually high pumping pressures, difficulty injecting the design volumes of fluid and proppant, and/or the inability to achieve design pumping rate or screenouts.
The hydraulic fracturing industry is increasingly looking for an efficient, nonintrusive method for identifying poor wellbore to reservoir connectivity. Currently, step-rate tests are commonly used (Massaras et al. 2007) to give the operator an estimate of open perforations taking fluid, as well as frictional losses within the wellbore and near-field region. However, these tests are costly, time-consuming, and rarely accurately confirm the number of poor perforations (Cramer et al. 2019). Fiber-optic technologies can improve these uncertainties but are costly and susceptible to damage during installation and/or operation.
How the Method Works
Low-frequency hydraulic tube waves, or Stoneley waves (Stoneley 1924), are induced at the surface by equipment connected to the wellhead. Tube waves travel rapidly through the fluid within the wellbore and reflect by any changes within the hydraulically connected parts of the wellbore. In this case, the reflection off the bottom of the well influences the tube-wave properties—dispersion and attenuation of the normal modes (Hsu, Kostek, and Johnson 1997), depending on the condition and number of the perforations, the quality of their connection with the near-field region, and the quality of the near-field region itself (e.g., a region already naturally fractured) [Dunham et al. 2017].
The measured conductivity of the most recently perforated stage is compared to an established conductivity threshold and pumping parameters of previously measured and treated stages. A warning signal is generated when the conductivity is below the selected threshold and/or the reflection’s polarity indicates a closed boundary condition. The threshold may be adjusted as the treatment progresses and more information becomes available on both pre-frac conductivity values and the effects of treatments. Stage-by-stage pretreatment analysis can alert an operator of potential difficulties. Having this advance knowledge provides the operator opportunities to make informed, operational decisions, e.g., modifying the treatment design, or in the extreme case, additional perforations—either to replace holes that are not adequately taking fluid or to increase intake to the design parameters.
Niobrara Case Study With Step-Down Test Comparison
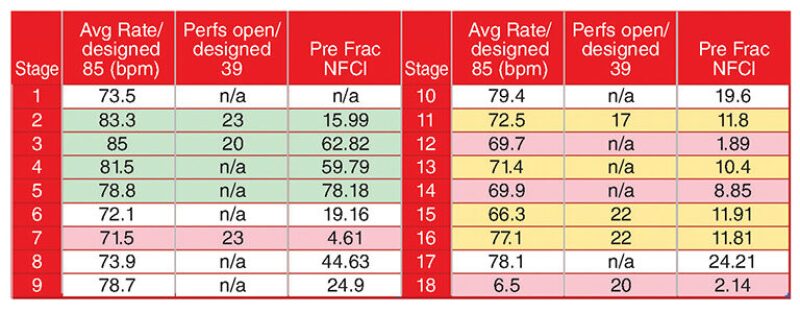
A client in the Niobrara requested the characterization of the fracture system using acoustic (tube waves) measurements after each stage was pumped. This is the standard procedure for perforation diagnostics and was successfully performed. Operations had already planned to include step-rate tests on multiple stages. Seven stages had a step-rate test deployed before the main body of the frac. Stages 2 and 3 employed flow-through bridge plugs, and operations would not allow the use of pre-frac measurements after the step-rate tests (with the ball seated on the respective plug). However, ball-in-place bridge plugs were used from Stage 6 onward, so pre-frac measurements were possible and provided an opportunity to compare the results with step-rate tests.
Fig. 1 shows the analysis of the step-rate tests for those stages for which this technique was used. The dark blue bars represent the total friction with the yellow dots representing the perforation friction and the blue dots representing the tortuosity. The dotted red line represents the pre-frac Near-Field Cluster Index (NFCI) while the dotted gray represents post-frac NFCI. Two observations are a relation between low pre-frac NFCI and high perf friction (psi) and between high post-frac NFCI and high tortuosity.
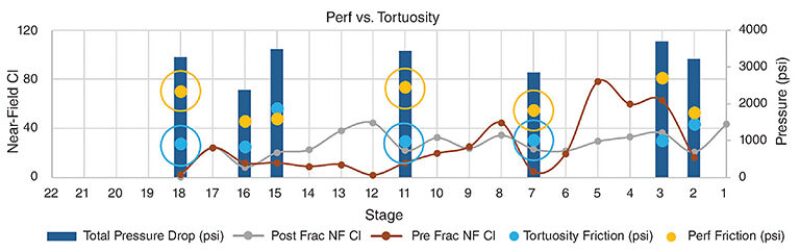
To compare the value of step-rate tests to the pre-frac measurements of the perforation condition, Stage 3 measurements of friction were evaluated. Note the apparent high-pressure loss due to perforation friction (20 out of 40 holes are estimated to be open), yet the pre-frac NFCI measurement was considerably high (circa 60). The pre-frac NFCI was measured before the ball was dropped to seal the bridge plug, but the post-frac NFCI measurement of the previous stage was one-third that of the pre-frac NFCI measurement of Stage 3, suggesting that a considerable portion of the measurement was that of the near-field region of Stage 3. This suggests that the stage should not be difficult to pump, and in fact, the plot of pressure, rate, and concentration of that stage should not demonstrate challenging events compared to other stages. Note the relatively flat rate close to the designed 85 bbl/min, effective breaks in the formation, and steadily increasing proppant addition.
Looking at the summary of all stages in the well (Fig. 2), significant challenges occurred during pumping for the stages with very low pre-frac NFCI and a ball-in-place bridge plug (Stage 6 onward), as indicated by the average rate. Stages 2 and 3 indicated low numbers of open perforations (using step-rate analysis) but showed high pre-frac NFCI and resulted in the treatment of these stages achieving high rates (designed rate was 85 bbl/min). Stages 7, 12, 14, and 18 registered as high risk (measuring closed system and/or lower than 7 NFCI). Significant pumping problems were experienced with these stages, most notably stages 12 and 18 screening out. Stages 11, 15, and 16 indicated moderate risk and experienced some difficulty pumping.
Conclusions
A simple pre-frac assessment using acoustic measurements can be readily performed in the time window between the perforation operation and the beginning of the main fracture treatment. These measurements and analysis do not impact operations and can provide a significant indication of the quality of the connection between the wellbore and the formation through the perforations. This allows the operator(s) to make informed decisions to the design plan that will result in an improved fracturing operation.
The relationship between the pre-frac perforation evaluation and the treatment of that stage has been observed in three unconventional plays to date: the Niobrara, the Eagle Ford, and the Haynesville. While the rock type alone can affect the perforation quality and rate of success, a basin/field agnostic series of results indicates that good contact with the formation when a high pre-frac near-field conductivity index is measured consistently results in a successful stage completion (lacking operational failures). Conversely, when a low pre-frac NFCI is measured, regardless of the basin or plan and unless costly and time-consuming mitigative action is taken, there are frequent difficulties in pumping the stage per the design, including early screenout followed by intervention to clean out.
The cost associated with operational difficulties, especially a screenout that yields a blocked well requiring coiled tubing or other means of clean out, can be offset by the addition of pre-frac measurements and analysis during the operation. Applying a pre-frac assessment requires no intervention, no additional time, no additional risk, and minimal cost compared to alternate diagnostics such as step-rate tests and fiber optics.
References
Cramer, D., Friehauf, K., Roberts, G., and Whittaker, J. 2019. Integrating DAS, Treatment Pressure Analysis and Video-Based Perforation Imaging to Evaluate Limited Entry Treatment Effectiveness.
Dunham, E.M., Harris, J.M., Zhang, J., Quan, Y., and Mace, K. 2017. Hydraulic Fracture Conductivity Inferred From Tube Wave Reflections. SEG Technical Program Expanded Abstracts.
Hsu, Chaur-Jian, Kostek, S, and Johnson, D.J. 1997. Tube Waves and Mandrel Modes: Experiment and Theory. The Journal of the Acoustical Society of America 102, 3277. Acoustical Society of America.
Massaras, L.V., Dragomir, A., and Chiriac, D. 2007. Enhanced Fracture Entry Friction Analysis of the Rate Step-Down Test.
Stoneley, R. 1924. Elastic Waves at the Interface of Separation of Two Solids. Proceedings of the Royal Society of London., A. 106(738), pp. 416—428.
This article contains highlights of paper SPE 201686-MS, “Multi-Basin Case Study of Real-Time Perforation Quality Assessment for Screen Out Mitigation and Treatment Design Optimization Using Tube Wave Measurements,” to be presented during the 2020 Virtual SPE Annual Technical Conference and Exhibition on 13 October. Additional case studies based on results from the Eagle Ford and Haynesville shales are described in this paper. Visit https://www.atce.org for more information.

Panagiotis Dalamarinis is a completions manager at Seismos. He has 12 years of combined research and operational experience in oil and gas. Areas of expertise include well design and optimization, drilling fluids design and optimization, and hydraulic fracturing design for conventional and unconventional reservoirs. He can be reached at p.dalamarinis@seismos.com.

Hoagie Merry is a senior completions engineer at Seismos. He joined the company at the beginning of 2019. He has experience in unconventional completion design and diagnostics from coal seam gas and tight sand assets in Australia to at least five unconventional basins in North America. With a background in mechanical engineering, Merry holds an MS in petroleum engineering from the University of Houston. He can be reached at hoagie.merry@seismos.com.