

Cash flow projections create insight and help avoid surprises, and economic yardsticks summarize characteristic features to make profitable investments. Those yardsticks have served us well, but today’s situations often differ from the ideals they presume. Instead of insights, traditional yardsticks in mature fields can create surprises. Buyers, investors, and lenders need new yardsticks—besides those based on present value—in order to make profitable decisions in mature properties.
Compared to initial investment and to the hoped-for initial cash flow, decommissioning costs appear minor and distant. Over time cash flow declines, narrows, and pinches to zero as production declines. By comparison to wizened late-life cash flow, decommissioning costs can be quite large. Capital coming back out of pocket and, literally, into the hole in the ground at the end of life can equal years of previous profits.
Proved Developed Producing reserves, often considered the least risky of the categories, actually become risky again late in life. As production declines, margins thin and the net revenue becomes much more sensitive to modest changes in volumes, prices, and even costs. Asset buyers often recognize the higher risk by using higher discount rates on late-life properties, placing less confidence and less value on the more-distant profits which may or may not occur as forecast.
Ironically, the same discount rate is applied to the decommissioning costs which are not uncertain. Though US regulators have permitted delays, the costs are definitively required by statute, by ethics, and often by contract, direct or indirect. By contrast to downside risk in profits, I find the uncertainty in decommissioning costs skews to the high side.
Despite the inconsistent risks and divergent uncertainties, present value yardsticks discount both the net revenues and the decommissioning costs in the same way. Decommissioning costs are naturally scheduled at the end of the economic life, so all of the guaranteed outflows are discounted (read “reduced”) more than all of the uncertain inflows. Our present value yardsticks thus wrongfully minimize impact of the end-of-life capital commitment, leaving purchasers and investors to be surprised by a capital obligation they did not see coming.
To make matters worse, our industry has in practice deferred plugging operations for years and thus accumulated decommissioning costs on assets whose production has been simultaneously depleting. The shale revolution has involved relatively few wells, a small fraction of the unplugged wells onshore in the US, and those are mostly not in the same assets as the millions of unplugged legacy wells. Systematically across US oil and gas fields, liabilities have been building and nearing while assets have been shrinking.
The accumulated liability amplifies the inherent distortion of discounting, and it is possible for a cash flow to calculate a present value discounted at 20% to be greater than a present value at 10%. In fact, it is possible for a cash-flowing asset to calculate a positive present value at 10% even when the total future net cash flow is negative.
Fig. 1a shows schematically how, early in productive life, the present value of a producing field declines with discount rate consistent with the theory of value. Adding decommissioning costs to the distant future moves the undiscounted figure little and the discounted values even less. This is the well-known theory and the most common situation in years past. Fig. 1b shows how the present value trend warps late in life. As the field approaches the point in time when undiscounted net revenues equal capital costs, the difference—namely undiscounted net cash flow—drops. Because discounting reduces the late capital costs more than revenues, the present value can be greater than the undiscounted value. Discounting no longer reflects the actual risk in the cash flow.
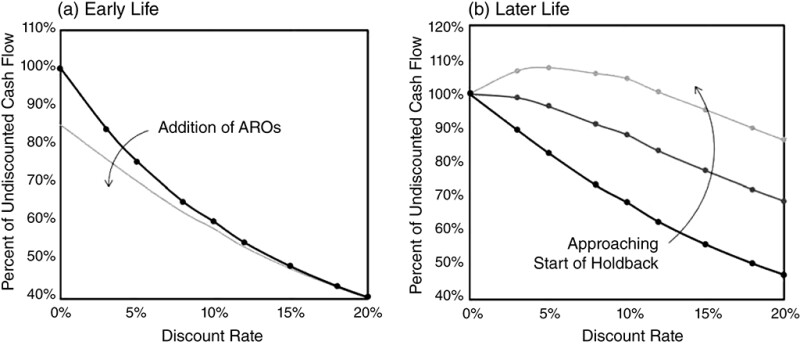
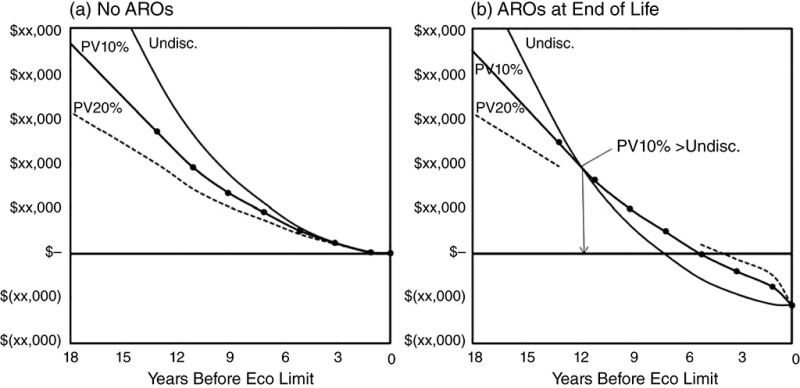
Fig. 2 looks at the same situation a different way. The x-axis is years until the field’s economic limit, and the y-axis shows the value at discount rates of 0%, 10%, and 20%. Moving to the right as the field depletes, values come down smoothly and converge at zero. This idealized scenario assumes no end-of-life costs, as well-accepted and understood. But the second graph shows the same demonstrative situation with the addition of accumulated decommissioning costs. The total future cash falls faster than discounted values, and the trend lines invert. Present value at 20% can be higher than present value at 10%, and both can suggest a substantial purchase price or loan value even when the owner will already have to pay more money than the property will generate.
Relying on present value, a purchaser might pay good money for a property whose costs already exceed revenues. A change in regulatory practices could suddenly convert a mature, producing asset into a decommissioning project with no free cash flow. Lenders may be surprised to learn that the cost of normal operations includes plugging, and that those costs supersede even their senior debt.
The solution to protect investments is to characterize the cash flows with a new yardstick, which I call “holdback,” merely payout in reverse. While payout is the years of cash flow equal to the capital expended before revenues, holdback is the years of cash flow equal to the capital expended after revenues. (First, of course, is to quantify and to include the full spectrum of decommissioning costs—and not just downhole plugging operations—in the projections, but this step is clearly endorsed by both common sense and recommended evaluation practices.)
From the foundation of holdback, other analogous yardsticks naturally build up. “Distributable life” is the time between present and the start of holdback. “Holdback coverage” is the ratio of net revenue to decommissioning costs, analogous in form to return on investment but exposing instead the risk of having to come out of pocket for retirement costs. “Discounted holdback” follows the form of discounted payout to treat uncertain revenues more explicitly, and “discounted holdback coverage” follows the powerful discounted return on investment. These paint a picture of the profits that can be kept or returned to lenders while still keeping obligations to the public.
For years, I’ve been telling my clients that, if they buy a property, they need to be prepared to bury it. The end of economic life is approaching for many properties, and the market increasingly recognizes that fact. Even so, the results of my holdback calculations have surprised me.
I’ve often found that, when there is a large standing inventory of idle wells, the end-of-life liabilities owed and ready to be paid now can equal the last 10 to 15 years, or even 20 years, of net revenue. Properties with many years of remaining productive life—but also accumulated decommissioning costs—sometimes allow the owner only a couple of years of distributable profits before all net revenues are required to cover its decommissioning costs. When a purchaser or investor can only take home 5 years of cash flow instead of 25, the investment looks radically different.
For Further Reading
SPE 210226 Economic Yardsticks for the End of Economic Life: Holdback and Its Adjuncts by Dwayne Purvis.
