

Rapid advances in computer technologies have transformed the ability to record, store, and transform a large volume of data. The collected data require intelligent software to deliver analytics solutions for better business decisions. However, large-scale transformation and processing of such enormous volumes of data, known as big data, require powerful computer hardware.
The hardware supports big-data processing pipelines from raw input data to predictive outputs. Therefore, building a hardware infrastructure is a prerequisite for high-speed processing of a large volume of information. Remote sensors, in particular, regularly generate a large amount of heterogeneous data that are either structured or unstructured. These data can carry complex intersensor relationships, time-dependent patterns, or spatial correlations. Given the complexity in such multivariate data structures, detecting deviations from these relationships is difficult.
In multisensor systems, predictive models aim to extract features from the sensor data to be able to predict whether a system is working normally. This is done by learning correlations between and within multivariate time-series data, recurring patterns, and their relations with the state of the system. Consequently, the models must be able to identify anomalous conditions in real time.
For example, in multiphase-flow measurement, different sensors are used to understand fluid distributions along the surface of objects and pipe cross sections. Predictive models can be used to learn these patterns, relate them to system conditions, and eventually predict device performance over extended periods of time. The development of these models provides end-users with a new level of understanding in terms of how the different fluids are interacting within the pipes, without the need for viewing sections and traditional flow pattern maps.
Modeling
Two types of computer models are used for solving engineering problems within sectors such as oil and gas production: physics-based models and data-driven models. These two classes of computer models differ in the way they represent physical processes.
Physics-based models attempt to gain knowledge and derive decisions through an explicit representation of physical rules and the generation of hypotheses about the underlying physical system. Physics-based models driven by physical processes normally can be described by a set of mathematical (theoretical) equations. For example, Navier-Stokes (N-S) equations explain the motion of fluids and can govern Newton’s second law of motion for fluids. Some N-S equations may require analytical solutions, but they are usually solved using numerical techniques so that they can be used for real-world problems such as weather forecasting. In the oil and gas sector, these models are constructed in accordance with the analysis of many surface/subsurface physical and chemical measurements across the oil field.
On the other hand, data-driven models uncover relationships between system-state variables without using explicit instructions. These models use algorithms to perform statistical inference and pattern recognition wherein a model maximizes its performance through an iterative learning process. Such models do not contain the full complexity of the true physical phenomenon. Instead, they provide a less-complex (but valuable) abstraction that approximates the real system.
Conventional data-driven fault-diagnosis methods often are based on a signal-processing unit and a classification algorithm. The signal-processing unit is used mainly to decrease noise and extract information from the raw data, while the classification model predicts faulty/healthy conditions. Using noise removal, however, requires specific signal-processing expertise, while feature extraction methods need to preserve the temporal coherence of time-series data.
Recent advances in deep learning (DL) have led to significant progress in predictive analytics for sensor devices. Unlike conventional data-driven approaches, DL methods do not require explicit modeling of noise removal or feature extraction as opposed to being detected by a human. Additionally, DL algorithms provide great predictive power in both supervised and unsupervised manners. As a result, predictive analytics derived by such methods presents practitioners with a wide range of data exploration and modeling tools to help them uncover new insights. However, the question remains as to how such solutions can be useful when facing unseen scenarios. In a statistical sense, the problem can be defined as training a data-driven model with a specific range of data while testing its performance outside that range. A robust solution will have a small discrepancy to the truth.
A data-driven model can also model the uncertainty associated with predicted outcomes. Fig. 1 depicts prediction and uncertainty quantification of a data-driven multivariate regression model that is trained with the first 80 data points (where multivariate refers to the target variable being dependent on more than one variable). The discrepancy between model prediction and observation, as well as the estimated uncertainty, becomes larger as the test point goes farther from the observed data interval. In addition, the model uncertainty estimated by a data-driven model can cover most of the unseen data (green dots after the first 80 observations).
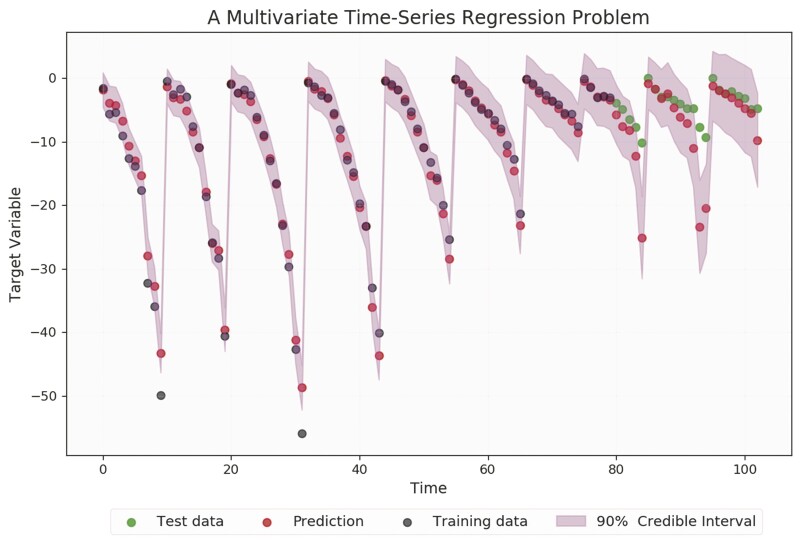
The multivariate regression results also can be used to examine the trend of the data and alert end-users to the presence of anomalous patterns that could indicate potential problems within the system.
Real-World Use
The oil and gas industry, and more specifically the field of flow measurement, continues to implement these examples in scenarios that make use of data-driven modeling to make strategic decisions. In addition, regular maintenance and viability monitoring of machinery and pipelines is a standard procedure in industrial sectors to prevent overwhelmingly heavy loss of asset and business failure for companies caused by unforeseen breakdown and erosion/corrosion. Therefore, the financial and operational benefits of real-time prediction have motivated industrial sectors to progress toward replacing time-based calibrations with condition-based monitoring (CBM).
Improved Decision Making
CBM enables real-time analysis of fluid conditions while quantifying the uncertainty of predicted outcomes and therefore provides deep insight into the status of operational systems. CBM also may include anomaly detection or highlight potential problems in the system before equipment is damaged. This requires a full understanding of the associated ‘real world’ infrastructure and the relevance of the associated data before one can expect to fully realize the cost-saving potential of such practices.
A better understanding of the data also leads to a more-efficient decision-making process (either automated or human) in areas such as production optimization and custody transfer scenarios. In particular, interest has been growing in real-time monitoring of multiphase flows because this can play an important role in efficient oil recovery and reduce operating and maintenance costs. This had led to an increased reliance on multiphase flow meters to provide an accurate online measurement of oil and gas production.
Multiphase meter manufacturers typically design their meters to include mixers, blind T junctions or restrictions on the installation to a vertical orientation to help homogenize the flow. Control or prediction of the flow regime within a pipeline is not easy, however, because the regime depends on individual phase flow rates, properties, and local process conditions. Flow regime dependence is a major challenge for many commercially available multiphase flowmeters—for example, inaccurate measurements because of flow regime changes affecting the localized sensing path.
Through ongoing research, the TÜV SÜD National Engineering Laboratory has developed an online data-driven monitoring system for multiphase flow measurement (MPFM) technology that reports the volume or mass of oil, water, and gas within pipelines.
This uses real and synthetic time-series data pertaining to fluid property information to build data-driven models with the ability to predict the presence of specific flow regimes within the pipeline. The real time-dependent data was output by the meter, whereas the synthetic data was created using statistical approaches to help determine flow patterns probabilistically.
This data-driven modeling approach does not rely on prior knowledge of the underlying flow model behavior. Instead, an ensemble of neural networks models is used to discover the connections between the flow measurement system’s fluid properties and probabilities of flow regimes. The parameters of these models are then tuned in the training/validation phase using historical and synthetic data. Eventually, the predictive capability of the models is evaluated against an independent unseen set of data for which the true classes are known.
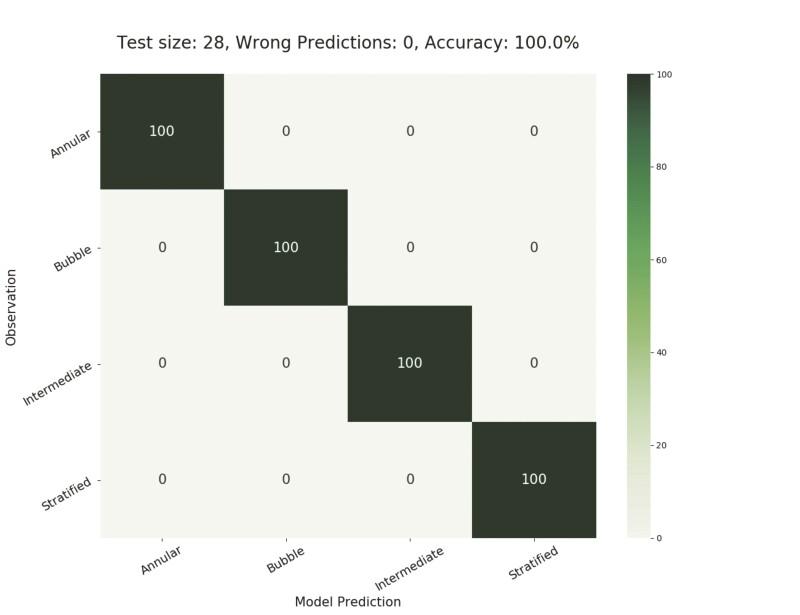
Fig. 2 illustrates the promising prediction performance of one such model when tested against an unseen test set of data in the form of a normalized confusion matrix. A confusion matrix is a matrix that is widely used to illustrate the performance of a classification model on a test set. It is called a “confusion matrix” because it shows how the classification model is confused when it makes predictions. This gives a clear insight into the types of errors made by the classification model.
Each row of the matrix represents the instances in an actual class, while each column represents the instances in a predicted class. In Fig. 2, the main diagonal from top left to bottom right represents the accuracy of prediction for each class. Conversely, the off-diagonal elements of the matrix refer to the percentage of wrong predictions. Therefore, ideally, 100% accurate predictions would be seen on the main diagonal of the matrix and zero elsewhere, which is the case for this model’s performance.
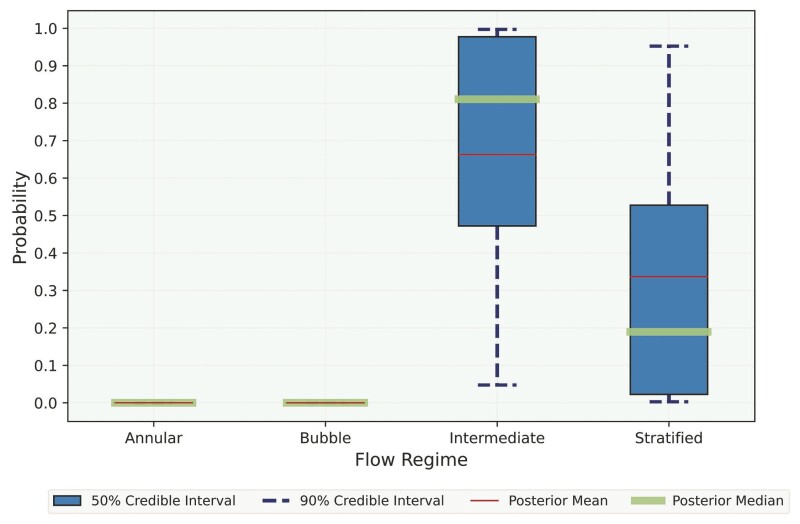
However, in most real-world examples, the flow regime changes throughout a given process and, therefore, a mixed flow regime with high uncertainty presents itself. Incorporating uncertainty improves predictive performance, even when test data depart from the training data. Moreover, knowing the fact that a neural networks model’s prediction may be overconfident, uncertainty is modeled within the data-driven models. As a result, these models do not have exact values for their parameters but a distribution over each parameter. This makes them flexible in their ability to predict the probability of each test under uncertainty, as shown in Fig. 3.
Although the model was trained with annular, bubble, intermediate (slug), and stratified flow regimes, it is still able to (probabilistically) predict mixed flow regimes where there is a clear transition from one regime to another. Fig. 3 clearly shows the application and successful prediction of a stratified-intermediate flow regime that is more weighted toward an intermediate flow regime.
Addressing Future Challenges
The downtime of manufacturing machinery, engines, or industrial equipment can cause an immediate loss of revenue. Reliable prediction of such failures using multivariate sensor data can prevent or minimize the downtime. With the availability of real-time sensor data, machine-learning and deep-learning algorithms can learn the normal behavior of the sensor systems, distinguish anomalous circumstances, and alert the end user when a deviation from normal conditions occurs.
As for flow measurement systems, the real-time prediction of flow meters in machine-learning applications and flow-pattern changes throughout multiphase-flow measurement can be monitored. Ongoing research will elaborate further on solutions to two major challenges:
- Improving the generalization capability of data-driven models for accurate real-time prediction of flowmeter diagnostic parameters
- Quantification of the uncertainty of prediction outcomes (i.e., model uncertainty)
The automation of work flows using machine learning and advanced statistical methods adds business value. In addition to prediction accuracy, a realistic uncertainty quantification of the model’s predictions enables predictions to be made with a high level of confidence. While equipment is in service, CBM provides real-time continuous monitoring of fluid conditions in different applications without interrupting any operations in the system, a real benefit for the industry.
Research is underway to improve the capabilities of CBM, not only to predict the state of the system but also to provide specific diagnostic information to the end user. Recording of all data from multiple digital networks through a bespoke data-acquisition package will make data easier to store and, subsequently, analyze. The results from such activities will support assessments of the current and future functional capability of equipment and help achieve a more-accurate determination of the nature and schedule for required maintenance.
