
As the industry shifts from a high number of short-length wells to fewer, but longer lateral wells, the stakes are raised for operators as bigger does not always mean better and economies of scale are reduced. This article describes how the application of optically derived, in-situ measurements enables completion engineers to optimize the design and execution of frac operations and successfully reap the rewards of quality over quantity.
Going long: a risky strategy
The success of unconventional resources has changed the landscape of energy production globally. However, owing to the fundamental need to fracture otherwise impermeable formations and the inherently short productive life of frac wells, the economics of unconventional resources remains a capex intensive challenge. Operators are seeking the cost savings of reduced well counts, whilst achieving the same production with lower environmental impact. This has led to a shift from the development of large quantities of short lateral wells to fewer, long lateral wells as the performance of directional drilling technology has advanced. This is all very logical and has many parallels with conventional wells, especially with offshore developments where the cost of drilling is high, and facility footprint is limited.
These parallels end quickly, however, as the benefits of drilling longer laterals in unconventional plays are offset by an even greater challenge for achieving effective completion and stimulation of a more complex well. The previous convention of short, geometric stage design is no longer economically viable as the time to execute the complete frac job is now infeasibly high. Simply increasing the stage length has been proven ineffective as the distribution of proppant and effective control of the perforation friction pressure become subject to greater influence from variables associated with the specific subsurface conditions. Finally, and in direct correlation to the previous issues with effective stimulation, the risk of fracture driven interaction is also magnified as the stage count increases owing to increased probability for run-away fractures and/or low-pressure zones in neighboring producing wells. As a result, operators are turning to an information-led, engineered approach to completion and frac design to achieve a greater understanding of the performance of a frac job relative to changes in design parameters. i.e. customized designs to suit the specific well geometry and subsurface conditions.
Measuring success by picking holes
Central to success of this approach is the fact that engineering decisions are made based upon performance feedback. Some operators may have already made the transition from geometric to engineered stage designs, but only those who incorporate post-frac diagnostics, and evaluation of success with respect to key parameters, have truly maximized the benefits of this shift in design philosophy. One such parameter is the distribution of proppant placement within the stage, as an understanding of the precise locations that have received proppant into the formation, and the relative volumes in which this has been achieved, provides direct identification of points of fracture initiation and a measure of their propagation. Specifically, operators who master their completion designs to deliver a controlled, even distribution of proppant, combined with an optimized stage length, benefit from a lower cost of completion, higher rates of production and reduced instances of fracture driven interaction.
To achieve this enlightened position, leading operators turn to PerforationVA, part of EV’s suite of pioneering Visual Analytics services, to measure and quantify the change in the cross-sectional area of perforations caused by the flow of proppant through the perforation and into the formation. These highly reliable and high-precision measurements are proportional to the volumes of proppant that have been delivered into the pay zone, not just for the stage or sub-clusters, but at each and every perforation therein. By applying proprietary 360-degree video technology, PerforationVA derives high-precision, in-situ measurements of perforation geometry that are otherwise unobtainable by any other means. These precision measurements are presented to the end user via a powerful cloud-based, interactive analytics environment, allowing the identification of trends and delivery of visual and statistical feedback to evaluate the performance of their frac. Furthermore, owing to the power of the cloud-based computing environment, operators are not limited to reviewing wells in isolation, rather results can be linked and analyzed in combination to reveal performance relative to a field, basin or any other geographic benchmark.
From geometric to optimized engineered design
The proven success of applying PerforationVA to complete this journey is well documented in several technical white papers (see references below), and are well represented by the following case study based on a multi-well engineer > measure > feedback project that was completed for one of the leading unconventional oil producers in the North American continent.
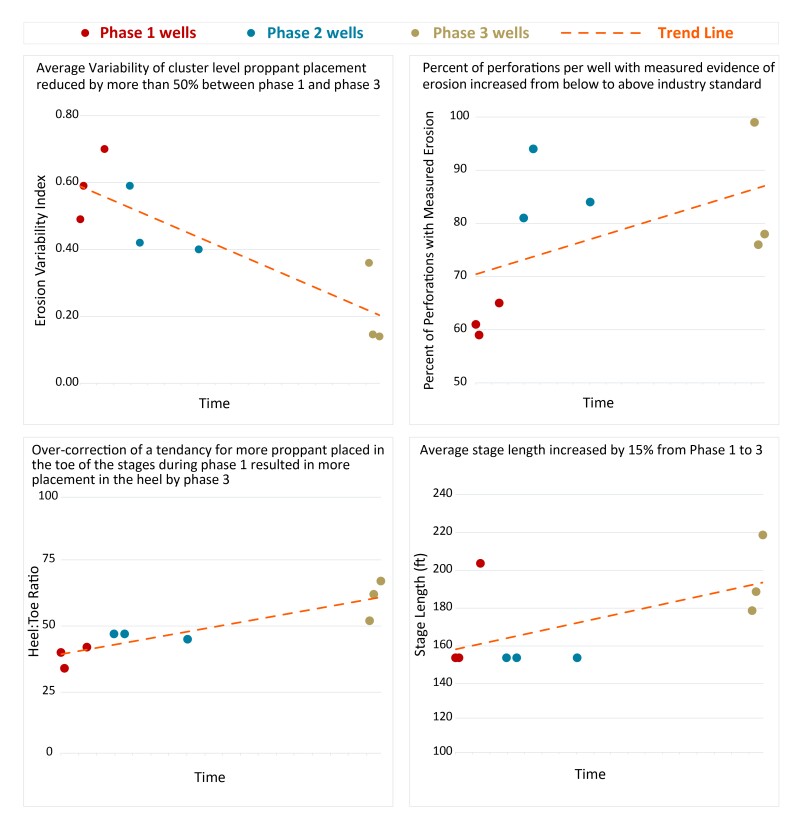
The operator deployed PerforationVA in a three-phase project over a 12-month period. In each phase three newly completed wells were evaluated. In Phase 1 a baseline was established for a set of treatment performance metrics using the operator’s existing stage and frac designs. Results showed a relatively low percentage of individual perforations had accepted proppant, and that the proppant placement had been strongly biased towards the toe half of each stage. At this point the key Erosion Variability Index - a measure of the variability of proppant placement at cluster level with a value of 0 being optimal - across the three wells was higher than the industry average.
Design changes, including focusing on engineered stages, with changes to the number of clusters per stage and a less aggressive perforation taper were quickly implemented for Phase 2. Results were encouraging with a reduction in Erosion Variability and a significant increase in the number of perforations receiving proppant. This resulted in a reduced tendency for proppant placement in the toe half of each stage, with close to 50%, on average, of the proppant now being placed in the heel half.
Using the feedback gained from Phase 2 results, further refinements to the designs were made and tested during Phase 3. The primary objective here was to increase stage length without an undue increase in variability of proppant placement. In fact, a clear decrease in variability was observed across all three wells, although the initial toe bias observed in Phase 1 had now become a heel bias.
Over the course of the project the operator was able to reduce variability in proppant placement by more than 50% while at the same time increasing stage length by 15%. Other metrics such as percentage of perforations receiving proppant improved from below to above the industry average.
Value to Industry
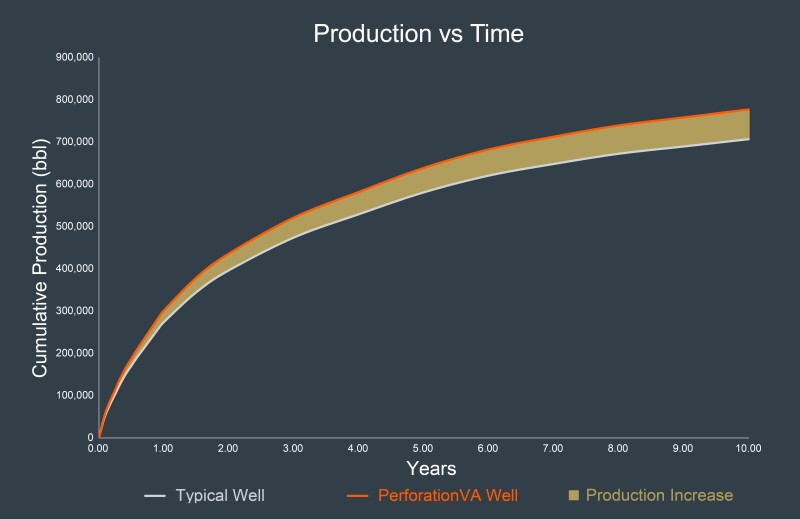
Based on information published by users of PerforationVA, the wells completed with the derived optimized designs benefit from up to a 10% increase in productivity, which at the time of writing equates to over $0.9m increase in revenue in the first 90-days and over $1.9m in the first full year of production. This incremental value, combined with significant savings on frac costs, is multiplied several-fold as the learnings from pilot wells are applied on a field-wide basis.
Whether a new drill or re-frac well, PerforationVA provides the most complete in-situ perforation evaluation available – a key parameter for maximizing of economic performance of unconventional wells.
Visit www.evcam.com to learn more and to find your nearest EV representative and discuss how PerforationVA may be applied to optimize your completion designs.
References
SPE 194334 Integrating DAS, Pressure and Video based Perforation Imaging to Evaluate Limited Entry Treatment Effectiveness by Cramer, Friehauf, Roberts, Whittaker. 2020.
SPE 204186 Proppant Distribution In Newly Completed And Re-fractured Wells - An Eagle Ford Shale Case Study by Allison, Roberts, Hicks, Lilly. 2021.
SPE 204177 A Shot in the Dark: How Your Post-Frac Perforation Imaging can be Misleading and How to Better Understand Cluster Efficiency & Optimize Limited Entry Perforating by Horton. 2021.
SPE 204203 Improved Treatment Distribution Through Oriented Perforating by Snyder, Cramer, White. 2021.
JPT: Imaging Fracturing’s Unexpected Changes by Rassenfoss. 2019.