In November 2020, Gustavo Ugueto had an extraordinary in-well experience. The source of his amazement was a stream of fiber-optic data measuring how fractures were altered by slight pressure changes during production.
When the principal petrophysicist for unconventional technology at Shell described the Permian well test, he sounded like someone who had used a stethoscope for the first time.
“The straining is extended and compressed at all times like breathing,” Ugueto said during a presentation at the 2021 Unconventional Resources Technology Conference (URTeC) about the test done at the Fracturing Test Site 2 in late 2020 (URTeC 5408).
He said it was an “aha moment,” as was getting a good signal considering the infinitesimal differences in the fracture dimensions in a well where the daily pressure drop was less than 40 psi.
And he was excited to think about what this test could reveal someday about how fractures change during production.
If it lives up to that potential, “we will have the ability to measure. We can experiment. What type of treatment? What type of proppant? We can do more of the good one and less of the bad one. The problem [now] is we have been working blind,” he said.
While he was clearly excited about the potential, he also repeatedly cautioned that there is so much more work required to learn what is possible. At this point, the few people with access to this data are like new medical students using a stethoscope, wondering how those sounds related to the patient’s health. “We are at the beginning of journey; it may fail,” Ugueto said.
The New Strain
The data from the Hydraulic Fracture Test Site 2 are only available now to those who backed the project, but three papers cover the work (see For Further Reading), sparking others to try this new way to measure fractures.
“Because of the publications by Gustavo and his coauthors, we are seeing a lot of uptake based on what was learned,” said Dana Jurick, Neubrex Energy Services US—the company that supplied the equipment used to measure the strain data. The company has since been hired for similar work by other oil companies curious about what they can learn from this new diagnostic.
The coauthors include Ge Jin, an associate professor at the Colorado School of Mines, who was a geophysics consultant at the Hydraulic Fracturing Test Site 2, and Kan Wu, an associate professor at Texas A&M, who is collaborating with Jin. Her group at Texas A&M is working on modeling aimed at turning this qualitative data source into a quantitative measurement.
Ugueto said other operators trying it, including Chevron and ConocoPhillips who were among the test site partners, plus other fiber-optic companies, are getting into a field that is so new there is no settled name for it.
Two commonly used labels for it reflect varying levels of optimism about its future. One is based on the data gathered: near-wellbore strain analysis. The other is based on a vision where it is possible to measure how fractures react to change: near-wellbore fracture dynamics.
Evolution of Strain
Near-wellbore strain is the latest tool used in the longstanding attempt to answer questions such as, What do hydraulic fractures look like, and how do they change when the downhole pressure rises or falls? The descriptions come in many forms depending on the geology, the training of the person answering the question, and their point of view.
“There have been a lot of debates about what a hydraulic fracture looks like” over the years, Wu said. The answers depend “on what scale you want to look at.”
For those using fiber optics to monitor fracturing, the scale has been large. Fiber-optic arrays have been used to measure the strain changes when nearby wells are fractured hundreds of feet away or to measure the height of fractures rising 1,000 ft or more.
Tests based on strain measurements only date back around 5 years and are rapidly evolving. At the upcoming Hydraulic Fracturing Technology Conference in February, six papers address large-scale strain monitoring of fractures.
“Little attention has been paid to in-well strain changes during production periods because of the limitation of current DSS [distributed strain sensing] solutions,” Jin wrote (SPE 205394).
The difference between the detection of a deformation during normal production vs. the rock-cracking strain created by pumping 80 bbl/min is like the difference between a whisper and a scream.
In this case the measure is based on the algorithms used to quantify observed changes in the strand of fiber-optic line.
When the well later used for the strain test was completed in summer 2019, there was talk of doing a traditional production logging test (PLT), but the operator, Anadarko, chose to put it into production without it.
The decision was in line with standard operating procedures in shale where the cost and risks of getting the PLT stuck in a long lateral looked greater than the value of the potential information that could be gained by running a mechanical flow-measuring device.
Jin’s paper explained, “Unfortunately the current generation of PLT devices have proven unreliable and inadequate in determining the relatively low flow rates expected from individual perforation clusters in unconventional wells with hundreds of potential inflow entries.”
Fiber optics have been used to measure production and fractures in a variety of ways, but no one had developed a method that could measure the minute strain changes associated with low fluid flow.
Around that time, a new method for measuring the data flowing back from the fiber was being offered—distributed strain sensing based on Rayleigh frequency shift (DSS-RFS).
Neubrex’s algorithms were created to detect exceedingly faint strain signals within wellbore segments as short as 8 in. using cable running along the entire length of the lateral. Other strain data measurement options offered lower resolution or were not able to cover such a long wellbore.
Fiber optics are used to measure sound vibrations, temperatures, and strain in and around wells by observing changes in the backscatter—the laser light reflected by the random imperfections in the glass-fiber line. Those unique signatures plus ultraprecise time measures of the return times are used to identify which section of the line is measured.
These measurements are done by an instrument called the interrogator. Strain measurements are based on how pressure changes in fractures alter the shape of the metal protective tube clamped onto the outside of the casing.
This measure requires a series of events: the well pressure rises; fractures expand causing the surrounding rock to deform, which affects the cement that alters the tube holding protective gel and the fiber. The fiber senses this minute change.
Strain testing was added to the agenda at the Hydraulic Fracturing Test Site 2 when a subgroup of companies agreed to support a test of a new interrogator unit made by Neubrex, which was programmed to do DSS‑RFS measurement. They wanted to see if it could measure strain changes at the scale of a frac cluster.
It was first used in February 2020 to measure strain changes during a 4-day shut-in that increased the downhole pressure in the Delaware Basin well by about 1,000 psi.
Before the well was shut in, data were gathered to establish a baseline measure of strain fluctuations during normal production. Based on early measures, Jurick recalled that he and colleague Artur Guzik agreed, “This looks terrible. Why is there so much noise in the Rayleigh backscatter data?”
After studying the data along with Ugueto and Jin, they concluded “it was the signal that we were looking for—the strain signal” during production.
The data was noisier than the measures made when the well was shut in—during which the pressure change was 25 times greater—but the signal seemed good enough to measure changes during production. “We made a recommendation to do a little more work based on what we saw; we explained why we should go back and they said, ‘Let’s do it,’” Jurick said.
When they did another round of data gathering in November 2020 to see how the fractures had changed, they included strain data gathering during production.
“We expected to see a signal. What we didn’t expect to see is a signal of such high quality. It came in so strong; it took us by surprise,” said Ugueto.
It was a eureka moment. Ugueto said, “We were detecting something important.”
Making Sure
That exciting moment of discovery was followed by the inevitable return to reality—gathering evidence to prove that they really did observe fractures adjusting to the pressure change, whether during production or after a shut-in.
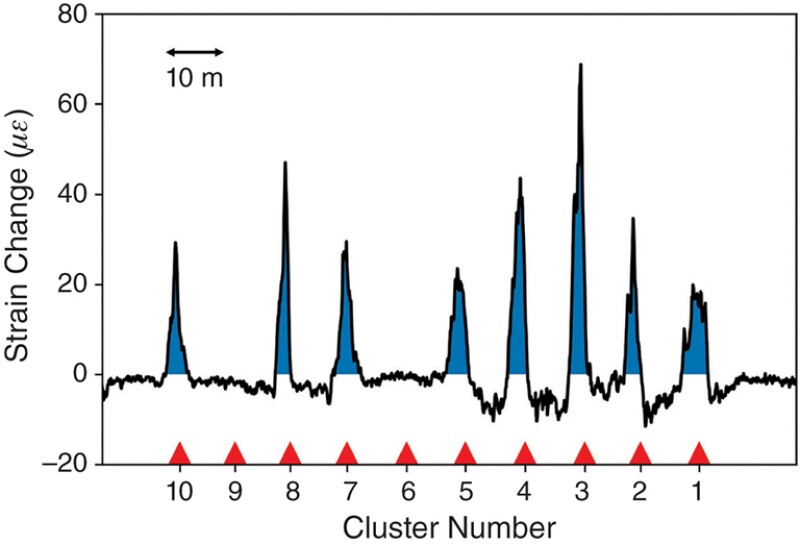
They compared the locations of measured strain changes with the measured perforation locations, and spots where fiber optics had measured the flow of fluid and sand into the reservoir. They found a strong correlation (greater than 95%) between where the sound of water and sand flowing through perforations was detected during fracturing and the spots where significant levels of wellbore strain were observed during production (URTeC 5408).
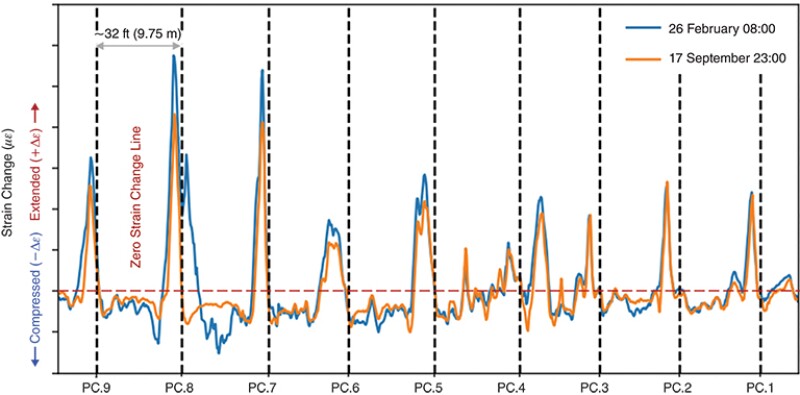
Further study of the data showed differences in the measurements in the clusters and changes over time. Recognizable patterns were detected in various strain charts. Ugueto said, “The signals change in a predictable manner. That was the next aha moment, and that is different for every cluster. It has to be related to geometry and to productivity.”
Based on their initial impressions, it appeared that a large strain change would indicate a perforation linked to a larger change in the fracture width, while no change at a perforation would suggest little conductivity.
Charts showing the location and magnitude of strain measures during and after a shut-in came in different forms: some tall and some short, some skinny and others fat.
Distinct differences in strain measures were seen in stages where different fracture designs were being tested with six clusters per stage and others with nine or 10 clusters.
Jin explained that on average, 6- and 10-cluster stages received similar amounts of fluid because the fluid pumped was adjusted based on the number of clusters. But the fluid intake varied from cluster to cluster.
Generally, the observed fracture zone, or wellbore sections with positive strain changes during shut-in, was wider in the 6-cluster stages, he said. But strain changes, as measured by the height of the peak, and the strain peak area, which is the equivalent to fracture aperture change, are larger in 9- to 10-cluster stages. “We currently do not have conclusions to determine which strain response is related to more productive clusters,” Jin said.
Ugueto pointed out there are a lot of variables to be considered such as the cost of more clusters vs. production lost from having too few of them.
This leads into things that oil companies usually do not disclose. While the US Department of Energy requires data disclosure when it is backing a test site, in practice what is made public tends to be in the form of a lot of data and analysis. Recipes for better fracturing are not offered.
Companies use the results differently, and no one has figured out yet how to use strain data to predict future fracture productivity. Modelers are just beginning to work on the tools needed to answer the question: Over the long term, which clusters, or fracturing methods, are likely to be more productive?
“To be honest, this observation is so new it is hard to say what it means,” Jin said, adding, “I believe we are on the right track.”
Data Promised Soon
At the top of the list of possible uses of this strain data is the evaluation of fracturing methods. “When you fracture a well you can list 20 different parameters to decide,” Jin said.
For years, the path to greater production was simple: pump more fluid and sand for more production.
That ended a couple years ago when the incremental production gains from that combination dwindled, and the operators became more cost conscious and began considering if spending less on fracturing intensity might deliver wells with a better return on investment.
“Now, when you try something, you have to wait 2 years and then the geologist may say, ‘Wait. That well may have better geology, so it should have better production.’ It does not matter the way you completed it,” Jin said, adding that the uncertainty slows the pace of completion down.
Strain measures may hold the potential of a direct test at the fracture scale and offer results much sooner. Delivering on that goal will require models that combine the data and other performance markers to quantify the relative performance.
“Relative” is an important word because strain data are not an absolute value. They cannot determine how much oil a fracture is likely to contribute, but can compare fractures in one spot to others in the well.
The first modeling done that drew on the near-well strain data was developed by Wu and her group at Texas A&M (URTeC 5436). She said the effort grew out of a discussion with Jin as part of their collaboration. She asked Jin if “strain is related to what you have done using modeling developed before.”
Using her strain models plus information about the strain measures in Ugueto’s paper and synthetic data they developed, Wu generated simulated results that were a good fit for the actual data plots. When Ugueto saw her results, it was another aha moment because it showed a numerical model could offer insights into the physical characteristics of the fractures behind the strain measures.
For Wu it was a promising start, but she is eager to get a chance to work with the actual data. She and others who worked at the test site will have to wait for the data to be made public, which Ugueto said is likely this spring. According to the federal rules, it must be released 2 years after acquisition, but the logistics of managing the release has led to delays in the past.
She and her team will history match the model results with actual data. “After we match the data, that will give us a direction,” she said.
While strain could prove to be a valuable bit of information for fracture modeling, it will need to be added to the many other bits used to analyze well performance.
This test could also mark the start of a growth period for fiber-optic measurements during production. At this point, these strain measurements require permanent fiber installations, which are costly, though Ugueto hopes that lower-cost options such as insertable fiber could eventually be used.
For now, it looks like a possible new argument to permanently install fiber. If this proves to be a valuable production measurement, “it opens up a whole new world of applications and value generation,” Jurick said.
For Further Reading
URTeC 5408 New Fracture Diagnostic Tool for Unconventionals: High-Resolution Distributed Strain Sensing via Rayleigh Frequency Shift During Production in Hydraulic Fracture Test by G.A. Ugueto, Shell Exploration & Production Co.; M. Wojtaszek, Brunei Shell Petroleum Co. Sdn Bhd; S. Mondal, Shell Exploration and Production Co.; A. Guzik and D. Jurick, Neubrex; and G. Jin, Colorado School of Mines.
SPE 205394 Novel Near-Wellbore Fracture Diagnosis for Unconventional Wells Using High‑Resolution Distributed Strain Sensing During Production by G. Jin, Colorado School of Mines and G. Ugueto, Shell Exploration and Production Co., et al.
URTeC 5436 New Insights on Near-Wellbore Fracture Characteristics From High-Resolution Distributed Strain Sensing Measurements by Y. Liu, Texas A&M University; G. Jin, Colorado School of Mines; and K. Wu, Texas A&M University.
URTeC 943 Fiber Optic Sensing-Based Production Logging Methods for Low-Rate Oil Producers by G. Jin, K. Friehauf, and B. Roy, et al., ConocoPhillips.