

US liquefied natural gas (LNG) exports averaged 17.4 Bcf/D in the first 6 months of the year, 23% more than the same period in 2025, according to the US Energy Information Administration (EIA). Its latest Short-Term Energy Outlook estimates US LNG exports will average 17.3 Bcf/D in the second half of 2026 before rising to 18.7 Bcf/D in the first half of 2027.
Export capacity additions from startup production at new terminals and expansions at existing terminals boosted LNG exports at the fastest rate since the US began large-scale exports in 2016 (Fig. 1).
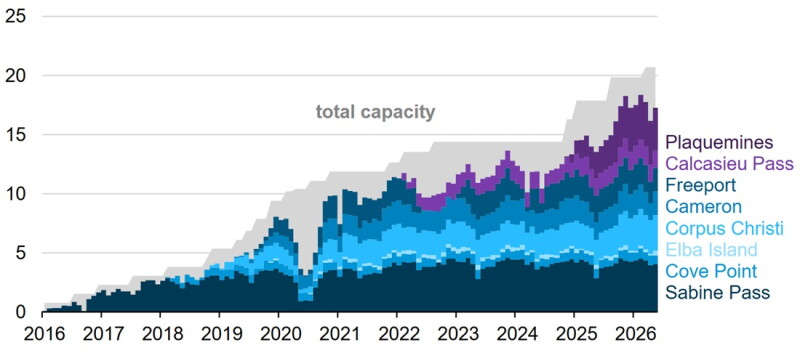
Plaquemines LNG is exporting at full capacity, and Corpus Christi LNG Stage 3 is currently exporting from six of seven liquefaction trains. These terminals, when complete, are expected to increase nominal US export capacity by a combined 4 Bcf/D.
Golden Pass LNG began exports in April 2026 and is expected to increase exports from Train 1 through the end of 2026, adding another 0.7 Bcf/D of nominal export capacity. Golden Pass LNG Train 2 is expected to be completed in late 2026.
Global LNG prices remained sufficiently high throughout the first half of 2026 to continue pushing US exports to near maximum output levels.
In March, disruptions to shipments of LNG through of the Strait of Hormuz cut off 20% of global LNG supplies, mostly from Qatar. The disruption pushed global LNG prices higher and forced Asian buyers, who import approximately 80% of Qatari LNG supplies, to compete for limited spot cargoes on the open market.
The average price at Europe’s benchmark Title Transfer Facility in the Netherlands was $14.74/MMBtu in the first half of 2026, up from $13.10/MMBtu in the first half of 2025. The price is the highest since Russia’s 2022 invasion of Ukraine, when prices rose to $32.42/MMBtu in the first half of the year as European buyers turned away from piped Russian gas.
The average Japan-Korea Marker price, the benchmark price for LNG imports into East Asia, also reached a 4-year high of $15.56/MMBtu as hot weather supported higher spot demand for LNG in the region, up $2.38/MMBtu from first half of 2025 and the highest since $29/MMBtu in 2022, according to Bloomberg data.
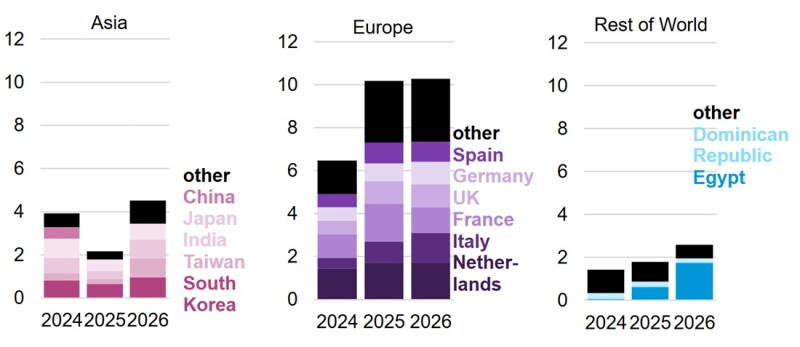
Market disruptions from the closure of the Strait of Hormuz contributed to a doubling of US LNG shipments to Asia in the first half of 2026 compared with last year (Fig. 2).
Exports to both Europe and Asia were both higher on a volume basis, rising 0.1 Bcf/D (1%) and 2.3 Bcf/D (108%) from the first half of 2025, respectively.
Exports to Latin America and the Caribbean and the Middle East and North Africa rose 0.8 Bcf/D (46%) from the first half of 2025.
Top destination countries included Egypt (1.7 Bcf/D), the Netherlands (1.7 Bcf/D), Italy (1.4 Bcf/D), France (1.2 Bcf/D), and the UK (1.1 Bcf/D).