

Early in the development of unconventional reservoirs, the industry had little choice but to rely on the toolsets handed down from decades of conventional engineering practices. Later, new tools would be crafted in the hopes of better fitting the unconventional paradigm. This presents a choice to the technical community—rely on a traditional and proven method, or one designed for the unconventional system but less tested? Recently, many hydraulic fracturing engineers have been asking themselves this question when it comes to the diagnostic fracture injection test (DFIT). That includes myself, and the journey I took to find an answer culminated in a technical paper (SPE 206239) that was presented at the 2021 SPE Annual Technical Conference and Exhibition.
What follows are some of that paper’s key findings which are being shared with the intent to further the discussion on best practices for those challenged with interpreting unconventional diagnostics.
The paper utilizes the concept of permeability to validate traditional minimum stress interpretations across multiple reservoir conditions by comparing DFIT fracture closure time permeability estimates with core, pressure buildup, after-closure pressure, and rate transient analysis. This author was able to further support the results by the integration of a wide range of diagnostic technologies such as fiber optics, microseismic, and, among others, DFIT numerical inversions shared through eight case histories.
Diagnostic Injections, a Long History Made Short
One of the few ways to begin a conversation with a reservoir is by pumping treated fluid at fracturing rates and analyzing how the pressure falls off with time after the injection is stopped.
The language for such dialogue and information exchange is formed by the dimensionless time function called “G-function” and was introduced by Ken Nolte in 1979.
Nolte’s innovative postulations allowed our industry to determine the expected frac geometry, its conductivity, the formation flow capacity, and the optimum hydraulic fracture design as well as the means necessary to place the treatment.
Recently introduced into industry literature is the proposed fracture closure pressure interpretation based on the fracture compliance method, interpreting an earlier, higher-stress estimation than estimates from well‑established methodologies.
The practitioner is now faced with the dilemma of finding out which fracture closure interpretation technique is correct since this has a profound impact on how fracture geometry is modeled and optimized. To answer this question, a multibasin analysis of pre-frac tests from the Russia, North Sea, Europe, North Africa, and South America regions was undertaken.
Our Wells Tell the Story, and Measurements Don’t Lie
The difference between traditional fracture closure pressure interpretation supported by well‑established methodologies and the new fracture compliance method is significant. Depending on which methodology is applied, fracture geometry modeling results in unrealistic fracture height growth, proppant lateral coverage, and pack conductivities that will negatively affect any fracture optimization approach.
Simply put, there is no magical theory, workflow, or software that will allow us to properly optimize our fracture treatments if we have a fundamental failure to understand the state of stress in the host rock.
Traditional fracture closure estimates are supported by field and laboratory experiments focused on the evaluation of the hydraulic fracture closure process.
Recent work done by a large university consortium, led by technical and credentialed researchers, showed that an induced hydraulically driven fracture relaxes over its entire length during the fracture closure process. This proves that fractures do not close from the tip(s) and the compliance, related to the characteristic fracture dimension, does not change during the closure process, which further invalidates the compliance method for fracture closure interpretations (Lai et al. 2016).
Physical measurements of fracture dimensions during pressure falloff have been examined and the results proved to be consistent with traditional estimations of fracture closure pressure. Moreover, the interpretation of the minimum stress was invariant over multiple injections of varying volume and time (Craig et al. 2017).
In the paper, I explain that the claims listed above were verified on a regular basis across multiple basins on moderate to low reservoir permeabilities where multiple injections are utilized to calibrate stress and fracture models, but the compliance theory does not allow a consistent stress interpretation across such injections.
In 2007, a relationship between wells’ initial production and the G-time value at traditional fracture closure was discovered by Conway et al. Their field-tested observation proved there is an intrinsic relationship between the time it takes for the fracture faces to close on each other and the host rock permeability (fast closure times equals more permeability). Therefore, if a relationship between the G-function and flow rate exists, then it is reasonable to expect a correlation between permeability and the G-function.
The paper utilizes an empirical correlation to establish a reservoir permeability centered on the time required for the fracture to close during a DFIT that is based on previous work done by Barree et al. in 2009 (Eq. 1).
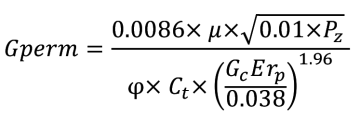
Eq. 1
Gperm= effective permeability (mD);
μ = viscosity (cp);
Pz = process zone stress;
φ = effective porosity;
Ct = total compressibility (1/psi);
Gc = Gtime at closure;
E = Young Modulus (MM psi);
rp = leakoff height to gross frac height ratio
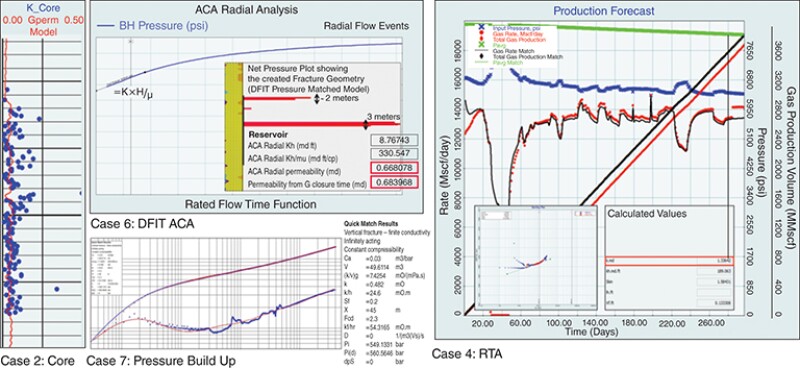
Even though eight case histories were shared in the paper, the multidisciplinary evaluation of reservoir flowing capacities of hundreds of wells across multiple basins proved that the concept of permeability can be utilized to identify the minimum stress on pressure falloff data. The integration of permeability estimates from DFIT after-closure analysis, core, pressure buildup, and rate transient analysis shows a consistent range that correlates with the estimations based on time required to reach well-established fracture closure interpretations (Fig. 1).
Important to note here is that our wells represent the largest laboratories in the world. With that, I argue that conclusions that can be drawn from the integration of multiple independent technologies and physics-based modeling solutions are just too strong to ignore.
The paper presents an integrated solution accounting for rock mechanics, pore pressure, stress, and, among others, permeability to validate traditional fracture closure pressure estimations through the numerical inversion of DFITs across a wide range of reservoir conditions.
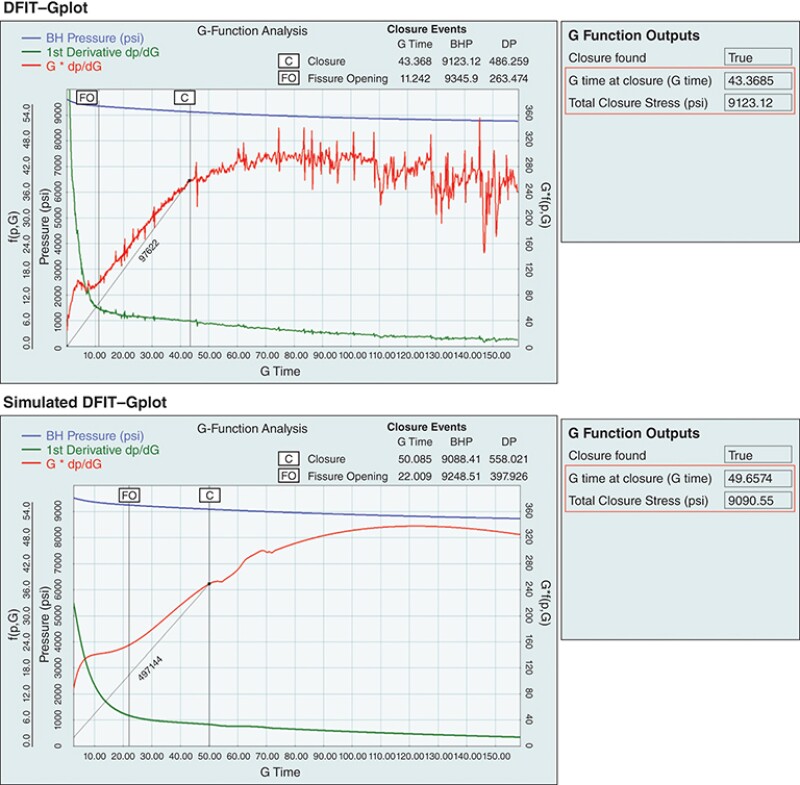
One case history corresponding to a DFIT pumped above the Vaca Muerta’s hot section called “The Kitchen” is presented in Fig. 2. The DFIT pressure match was achieved by implementing an iterative process constrained by traditional fracture closure interpretations of a grid-oriented planar 3D fracture simulator with shear decoupling. The validity of the analysis is supported by having the modeled pressure providing the same “tip extension” fracture closure mechanism, minimum stress, time to reach closure, and after-closure pressure transient dissipation as the measured falloff data (Fig. 2).
In this case history, the correctness of the estimated minimum stress was further validated by evaluating the predictive capabilities of lithology-based 1DMEM, fiber optics, and microseismic information. Fig. 3a shows the rock-physics-based elastic properties of this well on track 1 while track 2 includes the pore pressure, overburden, traditional and compliance-based 1DMEM (identified as the orange, black, red, and green curves, respectively).
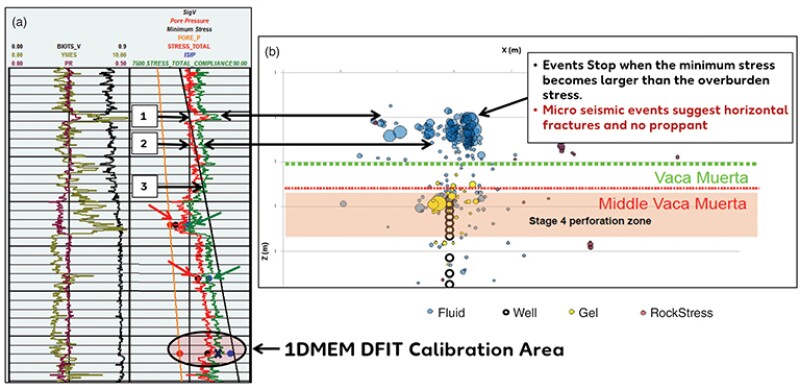
When calibrating the stress model to the interpreted minimum stress shown in the previous numerical inversion (marked as a red curve in the identified calibration area), the model can predict multiple closure measurements from injection tests made on different geomechanical benches (marked with red arrows and black points). Nevertheless, when utilizing the compliance closure stress interpretation to calibrate our model (marked as a green curve), the model cannot predict multiple closures measurements but rather its fracture pressure (or ISIP), which makes such interpretation invalid (marked as green arrows and blue points).
Moreover, the traditional 1DMEM (calibrated to the traditional closure pressure) can explain the independent assessment on fracture geometry provided by the microseismic data acquired in the upper Vaca Muerta that supports fracture height growth into a bounding tight carbonatic formation called “Quintuco.” Focal mechanism analysis supports the presence of a large quantity of horizontal fractures developed by fluid events with limited amount of proppant and a sharp termination of events at a predefined depth.
When carefully examing the traditional 1DMEM, it can be seen that all microseismic events stop when the minimum stress becomes larger than the overburden (marked as point 1 in Fig. 3a). At this position, the fractures will stop propagating upwards since the maximum stress plane will be parallel to the bedding of the rock. At the same time, right below this stress barrier, there is a region where the minimum and overburden stress have the same magnitude that coincides with the high-complexity zone identified in the microseismic cloud (as shown by point 2 in Fig. 3a). Under this condition, the fracture will not have a clear path to develop growth, and the fracture orientation will change from vertical to horizontal, explaining the development of horizontal fractures interpreted on microseismic events.
When looking at the compliance 1DMEM (calibrated to the compliance closure pressure), we can see that the stress becomes larger than the overburden stress at a much deeper depth, which does not allow for fractures to grow in height beyond this point and cannot be utilized to explain the microseismic events detected (point 3 in Fig. 3a).
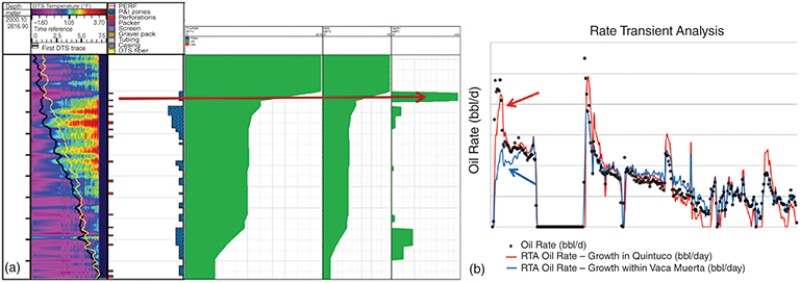
Fiber-optics data show that almost 60% of the production of this well comes from this last stage placed in the upper Vaca Muerta. Curious and rare enough, production came from the upper two perforation clusters instead of the seven clusters utilized to pump the fracture treatment, suggesting that a large flowing capacity unit has been contacted above them (Fig. 4a).
Key Takeway
This independent measurement cannot be rationalized by the compliance 1DMEM since such model does not allow fractures to growth in height towards Quintuco.
Furthermore, with the purpose of closing the interpretation loop, production modeling from the traditional and compliance-based 1DMEM contacted net pay is presented on Fig. 4b. Regretfully, the compliance-based modeled production cannot match the production from this science well during the first 2 months due to not being able to contact the additional reservoir volume supported by microseismic and fiber-optics measurements.
If Stress State Was So Misunderstood, How Does Production Improve?
The best proof that exists about the validity of traditional closure estimates lies in our wells, having the oil and gas industry utilizing this knowledge for decades to consistently improve the production performance of multifractured wells.
This would not have been possible if there was a wholesale, systemic misunderstanding of the source rock’s state of stress. In other words, it is a first-order dominant control on the success or failure of a stimulation treatment. As noted in the paper, “The overprint of effects in the production curve of any multifractured well are considerable.”
Developing and proving theories in highly uncertain environments such as shale reservoirs with limited data sets, coupled with a large number of fracture treatments, poses a challenge to proper validation.
To put things in perspective, the Vaca Muerta Shale case history required the integration of 10 strategically placed DFITs and a mélange of diagnoctic technologies to clearly understand the wells’ production performance.
Integrating results from both closure theories in lower-permeability reservoirs—where core, DFIT after-closure and pressure buildup data allowed the incorporation of the concept of permeability to validate traditional closure estimates—provided a wealth of information to understand the fracture closure process.
The early-time fracture closure identification supported by the fracture compliance method was severely tested against information provided by dozens of science wells across multiple regions under a wide range of permeability, pore pressure, and state-of-stress conditions. Its lack of validity was explained by the integration of well observations, diagnostic injections, pressure buildup, core data, stress modeling, production logging, tracers, fiber optics, microseismic data, and simple fracture width calculations.
The supporting theory of the compliance closure methodology might be mathematically consistent with the way fracture closure is described, but it is a physical process that cannot be reproduced in real fractures.
In sum, verifying theoretical results by utilizing fracture models built on physics that assume the described theory is real does not constitute validation. If you really want to learn about DFITs and how to bring value to your completions, read an old book. I invite those interested in learning more to access those readings along with the paper that is the focal point of this article and features a more exhaustive literature review.
For Further Reading
SPE 206239 DFIT: An Interdisciplinary Validation of Fracture Closure Pressure Interpretation Across Multiple Basins by H. Buijs.
SPE 36424 Determination of Pressure Dependent Leak Off and Its Effects on Fracture Geometry by R.D. Barree and H. Mukherjee.
SPE 39932 Applications of Pre-Frac Injection/Falloff Tests in Fissured Reservoirs—Field Examples by R.D. Barree.
SPE 107877 Holistic Fracture Diagnostics: Consistent Interpretation of Prefrac Injection Tests Using Multiple Analysis Methods by R.D. Barree, V. L. Barree, and D. Craig.
SPE 189866 An Engineered Approach to Hydraulically Fracture the Vaca Muerta Shale by H. Buijs and J. Ponce.
SPE 106085 Selection of Stimulation Fluids and Treatment Design for Low Permeability Reservoirs by M.W. Conway, S.W. Lindeman, and R.D. Barree.
SPE 187038 Fracture Closure Stress: Reexamining Field and Laboratory Experiments of Fracture Closure Using Modern Interpretation Methodologies by D. Craig, R.D. Barree, N. Warpinski, and T. Blasingame.
SPE 8341 Determination of Fracture Parameters from Fracturing Pressure Decline by K. Nolte.
Phys. Rev. Lett. 117, 268001 Elastic Relaxation of Fluid-Driven Cracks and the Resulting Backflow by C.Y. Lai, Z. Zheng, E. Dressaire, G.Z. Ramon, H.E. Huppert, and H.A. Stone.

Hernán Buijs, SPE, is a hydraulic fracturing subject-matter expert with Wintershall Holding GmbH. He has worked on multiple projects across South America, Europe, North Sea, Middle East, and Russia Regions. His main interests are reservoir characterization, formation damage, and reservoir stimulation, with a deep focus on hydraulic fracturing, complex HP/HT reservoirs, and all related technology. Buijs is active within SPE and was the recipient of the 2018 SPE Regional Completions Optimization and Technology Award. He has developed and taught courses on hydraulic fracturing and reservoir characterization as a university professor, invited speaker, and in-house expert. He holds an industrial engineering degree and a petroleum engineering degree from the Institute of Technology of Buenos Aires, Argentina.