This is an excerpt from paper SPE 218852. Find the complete paper on OnePetro here.
Joshua Neutel; Andrew Berson; Sarah Saltzer, SPE; Franklin Orr, SPE; Adam Brandt; and Sally Benson, Stanford University
California is the largest state in the United States by population and is poised to become the fourth largest economy in the world, after only the United States, China, and Japan. California has long been a leader in climate action, driving policy nationally and globally.
The California Global Warming Solutions Act of 2006 was the first program in the country to require a reduction of greenhouse-gas (GHG) emissions and take a comprehensive, long-term approach to doing so. Since the passing of the act, several other policies have been put in place to support California’s ambition for climate action, most notably, Executive Order B-55-18, which calls for the state to achieve carbon neutrality economywide by 2045.
The California Air Resources Board (CARB) recently published its 2022 Scoping Plan, a detailed sector-by-sector roadmap for reaching net-zero emissions by 2045 based on a technologically feasible, cost-effective, and equity-focused path. The plan ultimately achieves California’s carbon neutrality goal, while aligning with other statutes, executive orders, and direction from the board and the governor. This paper explores additional pathways for California to reduce its emissions from about 400 million tonnes/year (Mtpa) of CO2 equivalent to net-zero in under 25 years.
To carry out this work, the authors developed a new modeling tool called DECAL, Decarbonize California.
DECAL: An Economywide GHG Emissions Reduction Model
Scenarios in DECAL are driven by a series of user-defined, exogenous levers, which represent technology and policy decisions. DECAL has 893 levers, allowing for detailed scenario analyses.
DECAL was built in a commercial software called the Low Emissions Analysis Platform (LEAP). LEAP is commonly used by governments, nongovernmental organizations, consulting companies, and utilities to assess energy transition pathways. LEAP models energy consumption production and resource extraction, accounts for energy- and nonenergy-sector GHG emission sources and sinks, and keeps track of monetary costs and benefits. LEAP is not a plug-and-play model; rather, it provides a framework to build customizable models, such as DECAL, to investigate specific policies using real-world data.
Comparison of Model Outputs From CARB’s Plan and DECAL
Emissions Comparisons. DECAL was first compared to CARB’s 2019 GHG Inventory as well as 2019 emissions reported in the Scoping Plan. DECAL’s baseline 2019 emissions agree well with CARB’s emissions inventory.
The Scoping Plan details a Reference Case and a Proposed Scenario. The Reference Case reflects current trends and expected performance of policies identified in the 2017 Scoping Plan, some of which are performing better than expected and others that may not meet expectations. The Proposed Scenario achieves carbon neutrality by 2045, deploying a broad portfolio of existing and emerging fossil fuel alternatives and low-emissions technologies. To build confidence in outputs from DECAL, levers were set to match CARB’s Reference Case and Proposed Scenario as closely as possible, and results were compared.
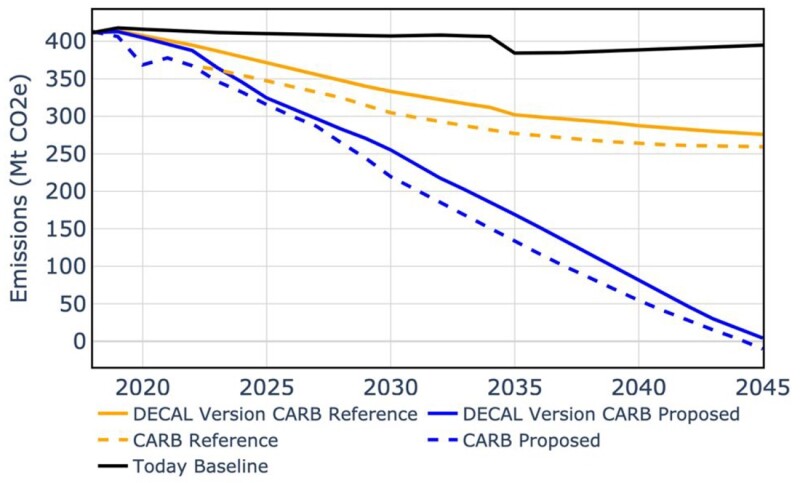
Emissions projections for the two scenarios and both studies are shown in Fig. 1. The figure also contains an additional scenario called the Today Baseline, which represents DECAL’s projection of the future given no changes from today but allowing for economic growth.
For the most part, the models run parallel. Overall, given the number of assumptions, data inputs, and variables at play, the authors consider the agreement to be reasonable.

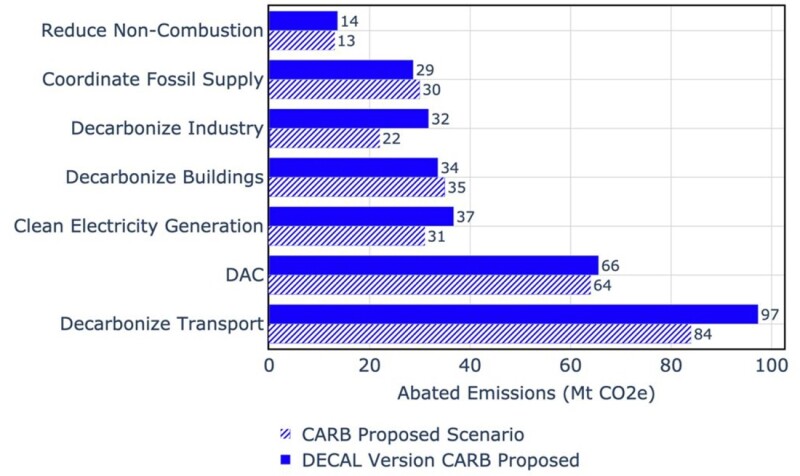
Finally, CARB provides a breakdown of 2045 carbon mitigation by intervention. The carbon contribution is calculated by reverting groups of levers at a time from their settings in the Proposed Scenario to their settings in the Reference Case. Results are shown in Fig. 2, with outputs being similar across DECAL and the Scoping Plan.

Cost Comparisons Between CARB’s Plan and the DECAL Model. Abatement costs that were reported in CARB’s Scoping Plan were estimated using DECAL. In general, it is difficult to compare costs between models because technology cost projections are highly uncertain, it is unclear in some cases what is and isn’t included in a reported cost metric, and there is uncertainty in defining the reference scenario and associated costs. For four out of the seven categories, costs are similar. There are large differences in cost estimates for clean electricity generation, direct air capture (DAC), and reduction of noncombustion GHGs. The authors speculate that the difference in electricity costs per tonne is partially because CARB does not include GHG reductions from electricity imports in its abatement cost calculation, which decreases the denominator (tonnes abated) and, thus, increases the reported abatement cost. In addition, CARB uses hydrogen-fueled power plants (a relatively expensive power source) in its capacity dispatch, which could add to the clean electric generation costs. As for DAC, costs in DECAL may be lower because of optimistic DAC learning rates or because of the use of different assumptions regarding incentives.
The cost of reducing noncombustion emissions is negative in DECAL because anaerobic digesters reduce imports of expensive RNG. Interestingly, in both studies, decarbonizing the transportation sector is cost negative, largely because of efficiency gains and high learning rates associated with zero-emission vehicles.
Key Technologies and Policies Needed in CARB’s Scoping Plan
Methods. Scenarios were run to further examine the role of various policies and technologies in CARB’s Scoping Plan. The analyses involve groups of levers being reverted from their settings in the Proposed Scenario to some baseline settings (as done in the Scoping Plan), except abatement contributions are compared to the Today Baseline. In addition, technology and policy measures are broken down into further subcategories (18 in total) to provide a more granular view of their contributions to emissions abatement. Finally, to explore the degree to which innovation is needed to reach net-zero, technologies are grouped into three categories—Available at Scale, Pilot Scale, and Research and Development (R&D).
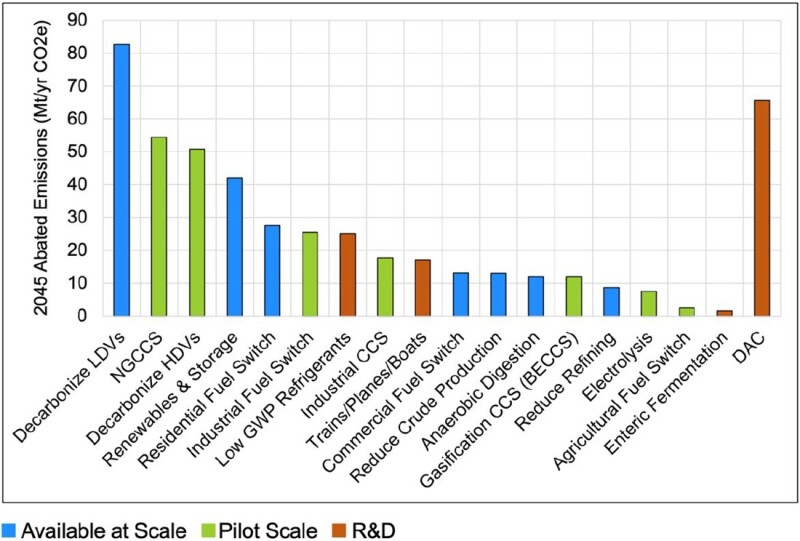
Results and Discussion. The contributions of 18 different measures to the net-zero pathway are provided in Fig. 3. Overall, the results indicate that 68% of emissions abatement is achieved with eight measures—Decarbonize Light-Duty Vehicles (LDVs), Natural Gas Power Plant with Carbon Capture and Storage (NGCCS), Decarbonize Heavy-Duty Vehicles (HDVs), Renewable Electricity and Storage, Residential Fuel Switch, Industrial Fuel Switch, Low Global Warming Potential (GWP) Refrigerants, and Industrial CCS.
Three of these eight measures—alone accounting for 32% of total abatement—use technologies that are available today. The other five measures should be considered high-impact target areas for research and development. In total, 42% of emissions abated in the DECAL Version CARB Proposed Scenario are mitigated with technologies that are available at scale today. An additional 36% are mitigated with technologies that are available at pilot scale, and 23% are mitigated with technologies that are in the research stage, including 14% that is mitigated with DAC.
Overall, much progress can be made with existing technologies, but reaching net-zero will inevitably require innovation across all sectors. Each measure shown in Fig. 3 represents tremendous deployment of capital and resources within the state.

The Role of Direct Air Capture
Using less DAC while still achieving net-zero will require even more aggressive assumptions throughout the rest of the economy. To assess the implications of using less DAC, a Minimal DAC scenario was developed. In this scenario, technology deployment assumptions in other sectors are made more aggressive so that DAC capture rates in 2045 could be lowered while still (nearly) meeting the net-zero target. Some levers were adjusted for this analysis. In general, sales rates were accelerated by about 5 years and adoption rates were increased by about 30% in 2045. Levers were also adjusted to increase use of bioenergy with CCS (BECCS).
Overall, DAC capture rates are reduced by about 50 Mtpa (77%) in the Minimal DAC scenario. While the difference between 67 Mtpa (DECAL Version CARB Proposed Scenario) and 15 Mtpa of DAC (Minimal DAC scenario) is significant, in either case, DAC will be needed at scale. Furthermore, reducing reliance on DAC requires pushing other decarbonization options beyond what are already aggressive assumptions in the DECAL Version CARB Proposed scenario.
Overall, despite highly aggressive assumptions, small emission sources remain throughout the economy, demonstrating the unforgiving nature of reaching net-zero emissions. It is fair to say that either the state will need even more aggressive technology adoption in these hard-to-abate subsectors or it will need large-scale carbon dioxide removal to compensate.
Conclusions
California’s goal of net-zero emissions by 2045 is much more challenging than its previous goal of 80% reductions from 1990 levels. This is because reaching true net-zero will require every emission source in the economy to be accounted for, otherwise the state will need carbon dioxide removal to compensate. The state can make considerable progress (just over 40%, according to this study) with strategies that are available today; however, even among commercialized technologies, the scale of infrastructure buildout that will be needed and the rate at which clean sales must be ramped up is enormous. Furthermore, the state will also need several technologies that are currently at the pilot or research scale, in particular zero-emission HDVs, CCS, clean industrial heating, low-GWP refrigerants, and DAC. Should these five technologies become available at scale, combined with technologies that are already on the market, the state could get approximately 94% of the way to its net-zero target, according to analyses done here.
The analyses also yield the following conclusions:
- To overcome the inertia caused by slow turnover time, it is important that the state meets or exceeds its LDV and HDV sales targets and that it establishes similar regulations for the buildings sector.
- To achieve the required buildout of electricity infrastructure, the state must become adept at rapidly permitting and building generators (solar, wind, NGCCS), battery storage, and transmission and distribution power lines.
- For some hard-to-abate industrial sectors CCS is likely to be the only decarbonization option, especially in the near term. In addition, a limited amount of natural gas with CCS is needed as a clean-firm power source in the electricity sector. Finally, CCS can serve as an alternative form of carbon dioxide removal when paired with biofuel combustion (BECCS).
- Plug-and-play biofuels such as renewable natural gas and renewable diesel are important to reduce remaining emissions in hard-to-abate subsectors, but demand must be carefully managed relative to regional and national feedstock constraints.
- Development and deployment of low-GWP refrigerants will be essential, given that refrigerants already account for a significant portion of emissions and given that technical solutions are currently limited or expensive.
- Carbon dioxide removal technologies such as DAC and BECCS are needed at scale for California to meet its goal by 2045.
This is an excerpt from paper SPE 218852. Find the complete paper on OnePetro here.

