There are two ways to measure how much entry holes grow due to erosion during fracturing, and the results they offer are often different.
This matters because these competing technologies, one using cameras and the other ultrasound, have become an essential tool for measuring fracturing performance.
When oil companies run side-by-side tests, there are enough differences in the hole size measurements to raise the question: Which one is right?
While the averages and trend lines for the data sets look close enough for engineers used to noisy downhole data, differences in the measures of specific entry holes can be disconcerting for those trying to evaluate performance at the cluster level.
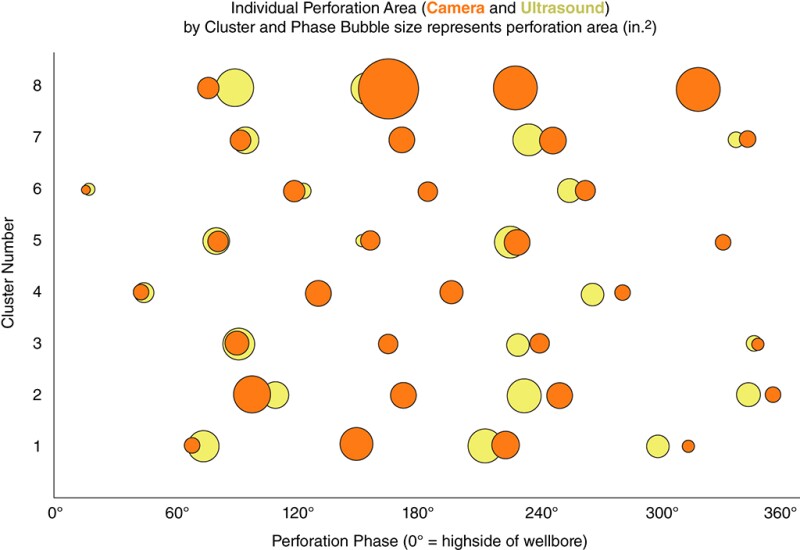
“There is quite a bit of disagreement in them, with gaps of up to 100%, and many gaps of 25% or more,” said Tobben Tymons, visual analytics director for EV, the company that pioneered visual imaging. He made that observation when he described the result of a two-well test where EV partnered with Archer to measure entry holes using both camera and ultrasound methods (SPE 212322).
The paper presented at the 2023 SPE Hydraulic Fracturing Technology Conference and Exhibition (HFTC) included Fig. 1 comparing the measurements using photos and ultrasound as pairs of colored dots within a stage in a side‑by‑side well test. The red dots were based on a camera image of the entry holes in the casing; the yellow were based on ultrasound.

They show that these tools can deliver significantly different measures for some of the holes.


